Dashboard overview
Dashboard Builder visualizes collected data so you can monitor metrics and identify patterns. Drag and drop widgets onto the canvas, then connect data with SQL or Simple Mode.
Main features
- Various types of widget libraries (5 categories): Provides statistics card·KPI gauge (numerical display) in the statistics card category, bar chart·line chart·scatter plot·pie/donut chart·heatmap·map in the visualization category, data table in the table category, date range selector in the control category, and text box·external site insertion (embedding) in the content category.
- Drag and drop: Freely create layouts and adjust widget sizes. It gives you a preview of where it will be placed while you drag and drop it.
- Free data connection (switch data mode in configuration panel):
- Simple Mode: Select datasets and fields on the screen and visualize them.
- SQL (Query Mode): Uses a SQL editor and an AI assistant that helps right away.
- Filters applied to multiple widgets at once — Date Range Selector (DRS): A dashboard-wide date range selector at the top of the screen. If no value is specified for the widget, this period is automatically included in the widget query.
- Widget-specific action menu: Duplicate, lock, download (CSV, Excel, PNG), and delete from the dot menu at the top right of each widget.
- Share & Permissions: Collection permissions are inherited (no wider permissions are given), and access is restricted to each widget.
- Export / Import Dashboard Exclusively: Export one dashboard from the dashboard list screen as a configuration information file (manifest) and import it in another environment.
- Review a dashboard configuration and SQL proposed in AI chat, then create a new dashboard in the same collection.
Dashboard list screen
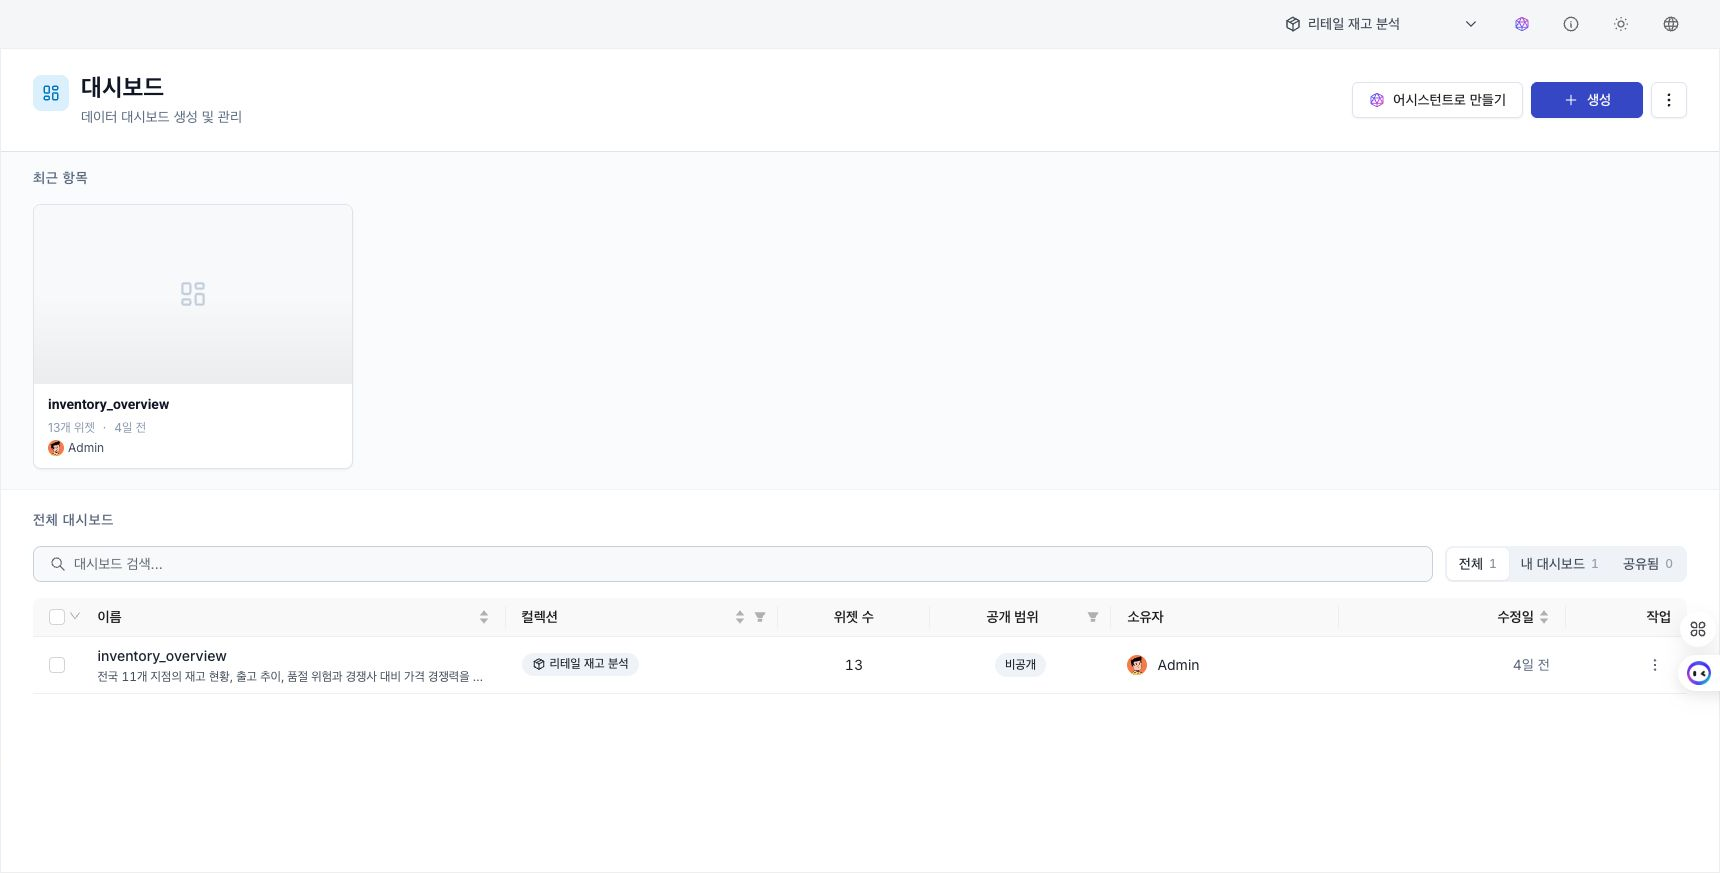
The dashboard list page (/dashboard) shows recent dashboards as a preview card (thumbnail) bundle at the top and the entire dashboard as a table below (there is no separate button to change the view method).
- Show aliases first: Shows aliases given to the dashboard as large names and names given by the system as small secondary names.
- Search: Search by name or nickname.
- Filter: Narrow the list with the All / My Dashboard / Shared buttons.
- Show owner: The owner is shown as profile photo (avatar) and name not only in the table's owner field (a preview will appear when you hover the mouse over it), but also on the top Recent Items card and in the header of the dashboard view screen. So, even if the dashboard was created by someone else, you can tell who owns it without having to go through the list.
- Sort/Page division (pagination): Follows the same method as other list pages.
Dashboard cards also appear in Recents as a small preview, with the owner's profile photo and name displayed on the card.
Edit screen composition
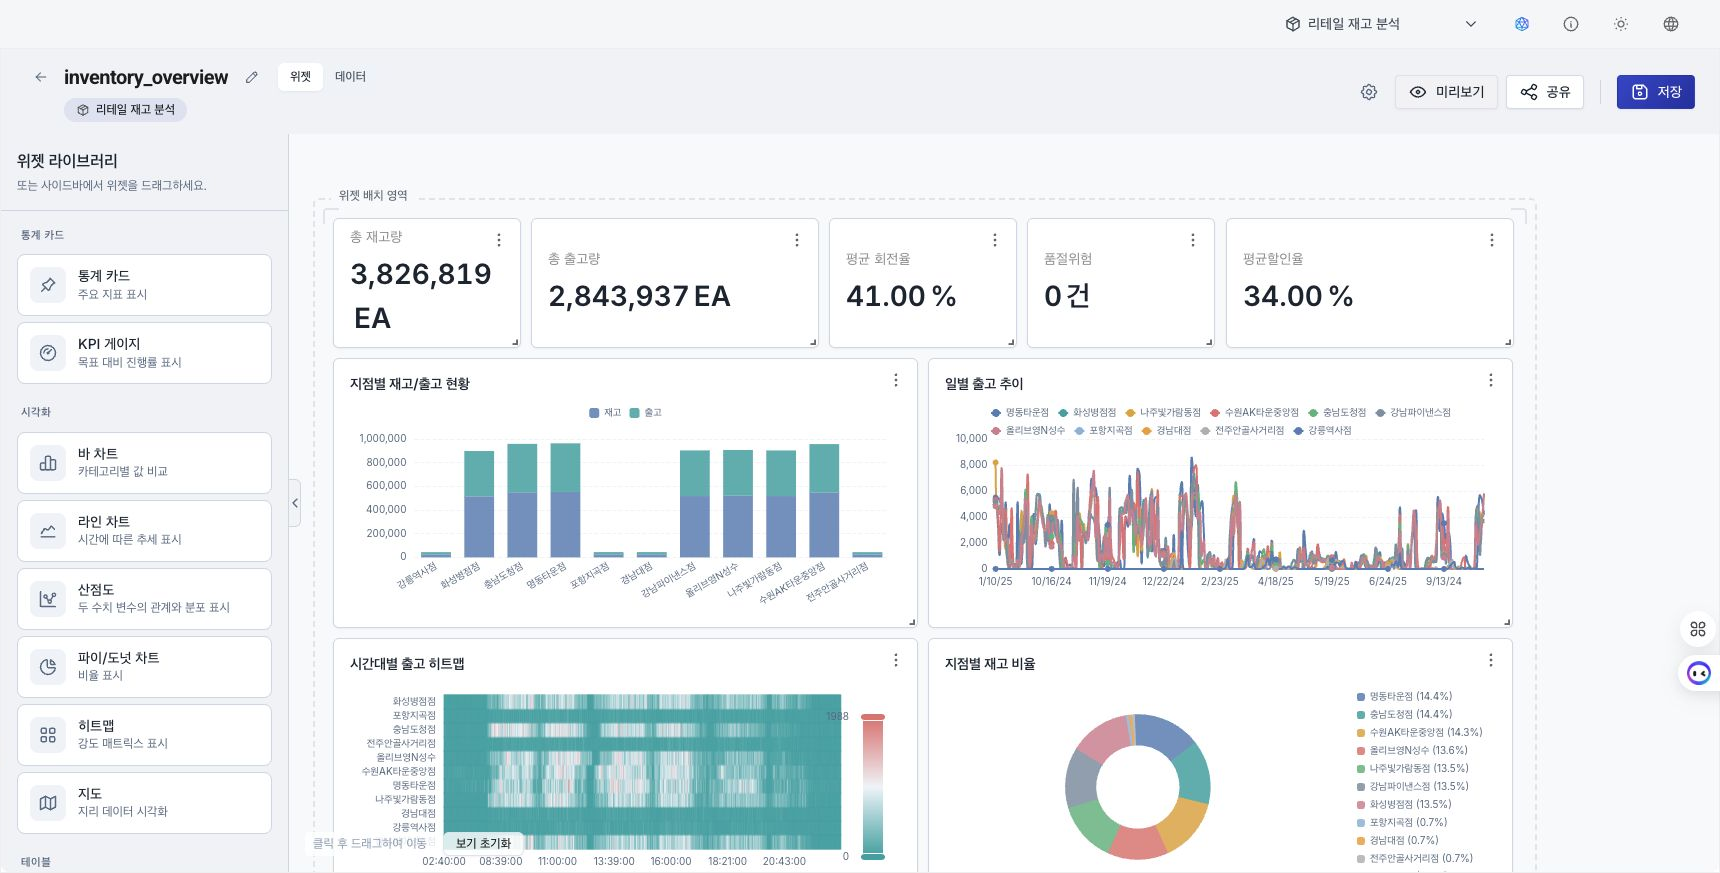
Dashboard Builder is divided into three main areas:
- Widget Library (left panel): Provides all widgets that can be placed on the canvas in five categories — Statistics Cards, Visualizations, Tables, Controls, and Content.
- Canvas (center area): This is the workspace where you place widgets and adjust their size. While dragging and dropping, it shows you a preview of where it will be placed on the grid.
- Configuration panel (right panel): Detailed settings for the data source, chart properties, and style of the selected widget. You can adjust the width by dragging the left edge of the panel (refreshing will return it to the default width).
The header at the top of the screen contains the following buttons:
- Dashboard settings (gear icon): Manage dashboard information such as automatic refresh cycle, title, and description in a separate window.
- Preview: Check the dashboard as it actually appears without any editing tools.
- Share: Adjust dashboard access permissions to the extent permitted by collection permissions.
- Save: Save changes.
At the top of the screen is also the Date Range Selector (DRS), a time period control that applies to the entire dashboard. If the widget does not specify a time column or period, this period is automatically included in the widget query. Export / Import of a dashboard alone is done from the dashboard list screen, not from the builder.
If there are unsaved changes and you try to leave the screen by moving the sidebar, going back, or closing the window, a confirmation window will appear and the changes will be saved.
Practical example
- Nowon-gu COVID-19 Analysis — This is a 90-minute workshop that integrates population, patient, and clinic data and explores relationships in local ontology.