Create and manage dashboards
The Dashboard List page allows you to manage all created dashboards.
Create a dashboard
- Click the sidebar Application → Dashboard to go to the list page.
- Click the Create Dashboard button at the top right.
- A blank canvas is created, and you can immediately start designing by adding widgets.
- When you are finished adding and setting the widget, click the Save button. The save result is notified by a notification at the top right of the screen.
If there are unsaved changes left and you try to leave the screen using the sidebar, back, or close the window, a confirmation window will block you once, preventing you from accidentally losing your work.
Dashboard list management
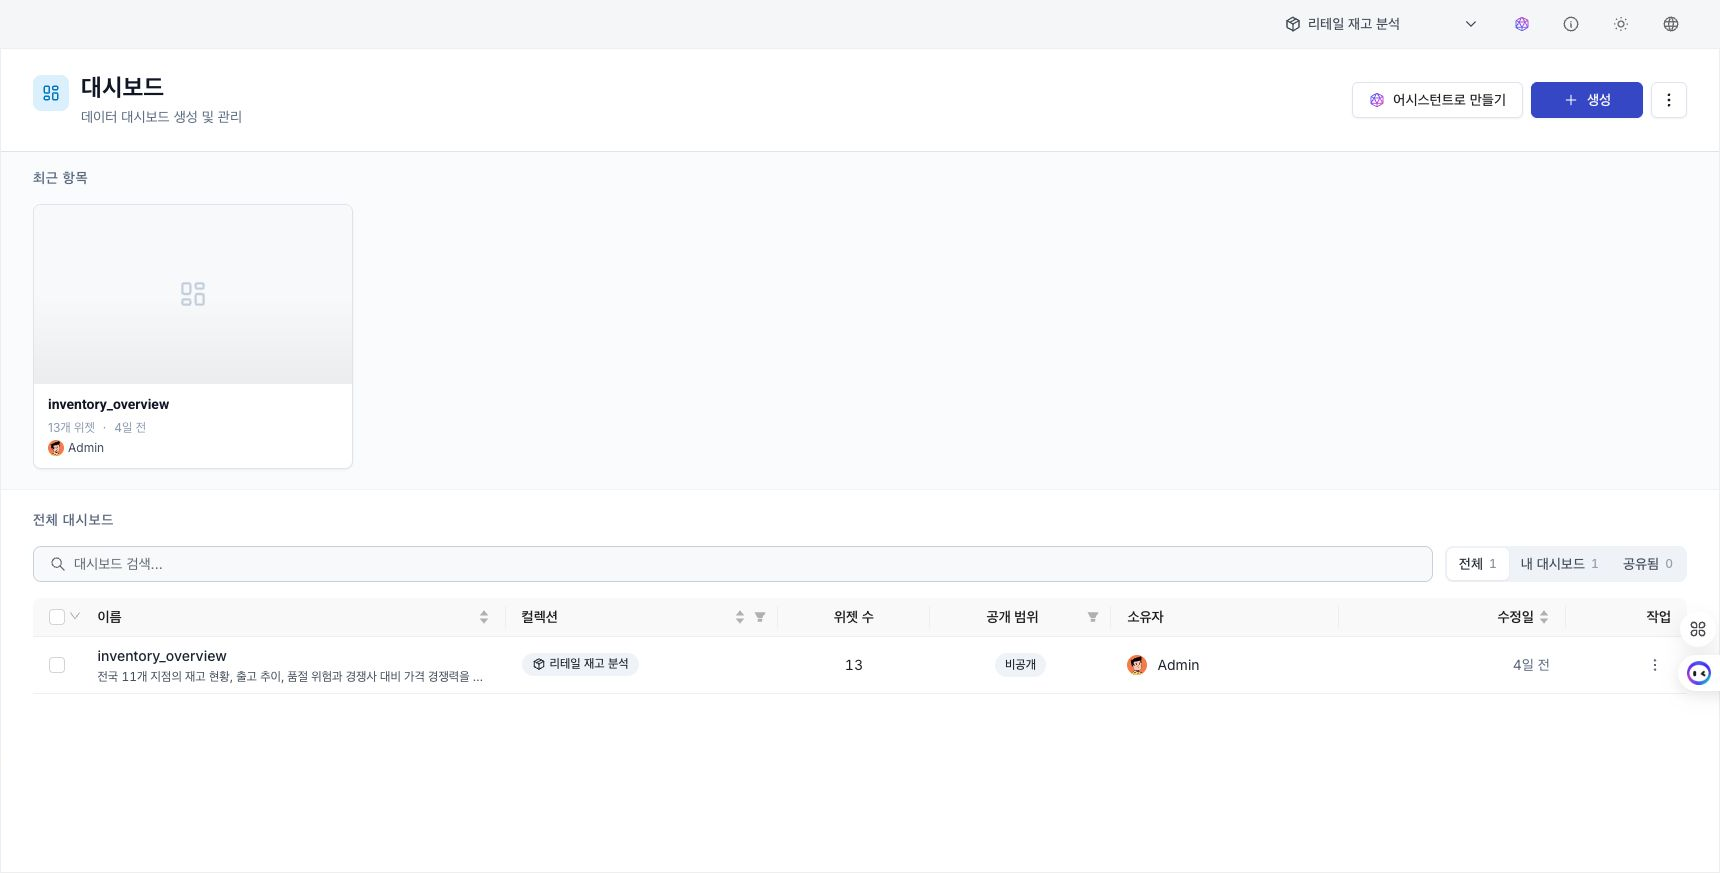
- Search: Search by dashboard name/alias.
- Filter: Narrow down to All / My Dashboard / Shared segments.
- Action Menu:
⋯menu for each dashboard.- View: Check in preview mode.
- Edit: Opens the dashboard in edit mode.
- Duplicate: Copy an existing dashboard and use it as a starting point for a new dashboard.
- Share: Opens the sharing/permission settings window.
- Export: Export one dashboard as a configuration information file (ZIP). For more information, see Share and Export.
- Delete: Permanently deletes the dashboard.
Dashboard Preview
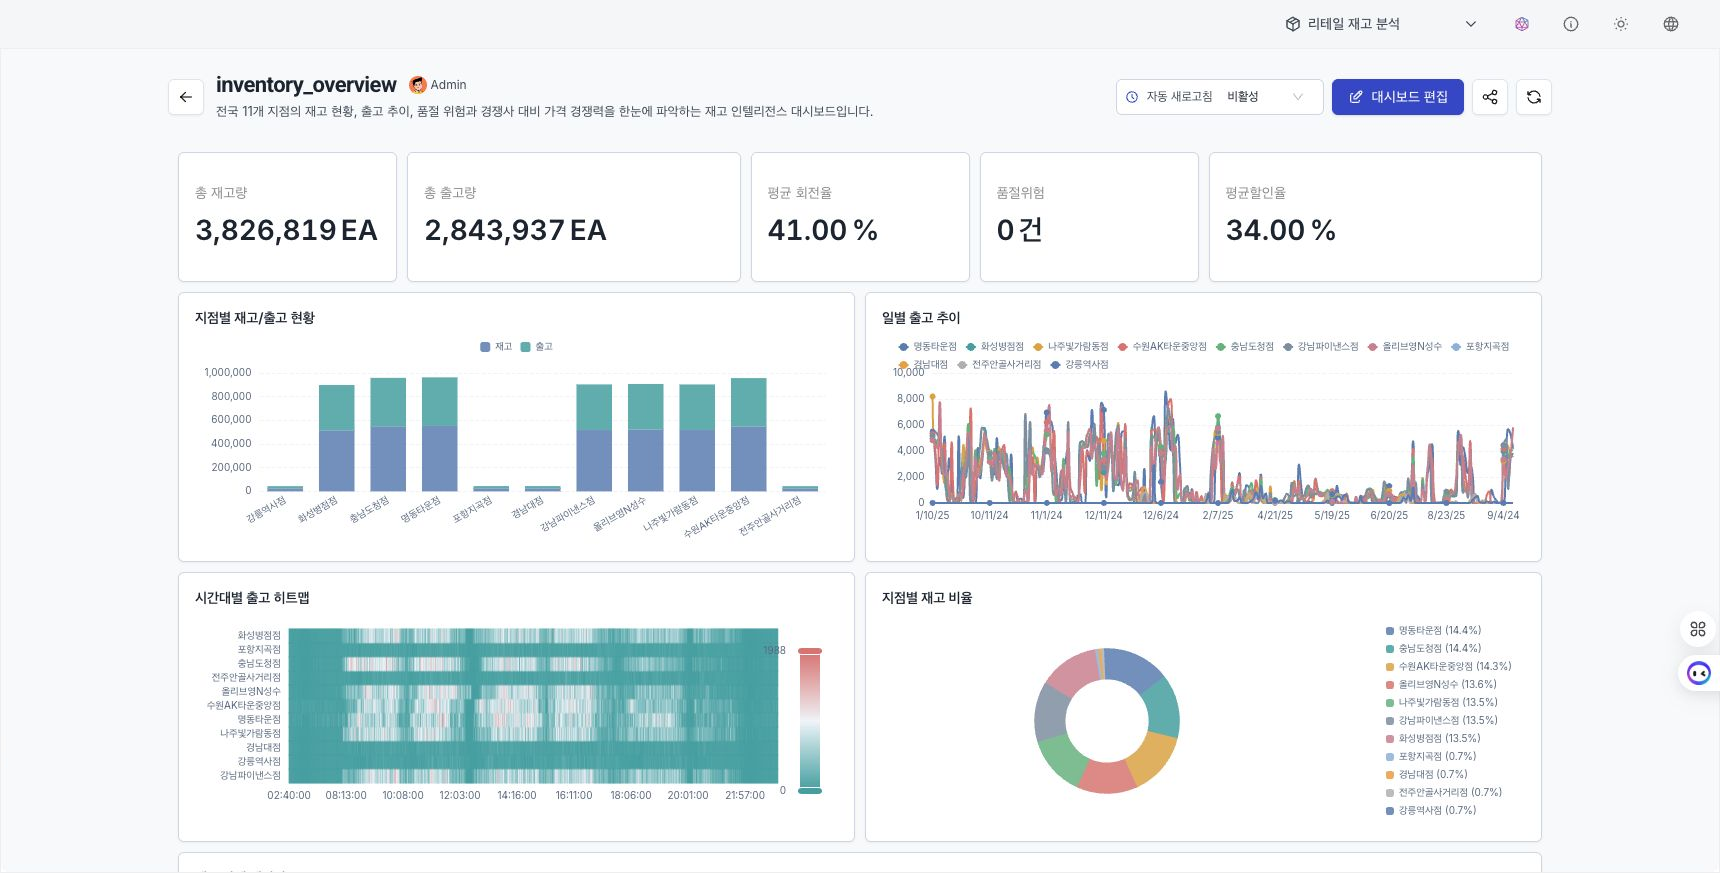
Preview is in read-only mode. It is designed for checking and analyzing data without editing the widget.
Preview features
- Owner notation: The owner avatar + name chip is displayed next to the dashboard title in the view screen header, so you can see at a glance who created the dashboard.
- Date Range Selector (DRS, Dashboard Range Selector): A tool to select the viewing period at the top of the screen. It provides pre-prepared ranges such as the last 7 days, the last 30 days, and user-specified, and if there is no separate time setting in the widget, this value is automatically applied.
- Auto refresh: Automatically refreshes data at the cycle specified in the settings modal. While DRS is locked to a custom fixed range, auto-refresh is disabled to prevent unintentional data changes.
- Manual Refresh: Instantly view the latest data with the refresh button.
How to access the preview
- Click a card/row in the dashboard list.
- Alternatively, click the Preview button in edit mode.
Edit dashboard
To modify an existing dashboard:
- In the dashboard list, click the
⋯menu of the relevant dashboard → Edit. - Alternatively, click the Edit button in the preview.
- Add/edit/delete widgets and then click the Save button.
Create from an AI chat plan
When an assistant or agent proposes a dashboard creation plan, first review the widget configuration and SQL in the approval card. Select Approve to create a dashboard in the same collection as the conversation target, then open it from the result card. If the proposal is not suitable, select Reject, change the conditions, and ask again.
See Dashboard plan preview and approval for the live preview and approval flow shown before execution.
Dashboard settings modal
The Dashboard settings button (⚙ icon) at the top of edit mode opens a modal to manage the following:
Basic Information
- Title / Alias: The name displayed in the header and list. You can use Hangul, spaces, and general punctuation marks, and enter up to 128 characters. Line breaks, control characters, and some symbols such as
<,>, and backticks cannot be used. - Description
- Tags: Tags for search and classification
Data Update
- Auto Refresh Cycle: Choose from five options:
30 sec·1 min·5 min·10 min·30 minor enter directly as Custom. Once saved, it will be applied immediately to both the edit and preview screens. - When DRS is locked to custom fixed range, auto-refresh cannot be set, and the cycle setting is also cleared when saved. Auto-refresh will not be turned on until DRS is returned to the predefined range (relative range) and then re-period.
- A clock icon will be displayed in the preview screen header when auto-refresh is turned on, letting you know that it is currently refreshed and updating in real time. Each time a refresh occurs, the icon rotates briefly.
The date range that applies when you first open the preview screen is managed by the Default Range(Default Range) option in the DRS widget. Do not place the same value twice in the dashboard settings modal. The default date range itself is meaningless in a dashboard without a DRS widget.
If you try to exit the settings modal without saving the changes, the same confirmation window will block you.