Configure widget data
Connect an analysis source to a widget, then configure the displayed data in Simple Mode or SQL mode.
Choose a task
| Task | Result |
|---|---|
| Connect an analysis source | Select the dataset, entity, or relationship queried by the widget. |
| Configure Simple Mode | Select fields and aggregation to build chart data. |
| Configure SQL mode | Run SQL and map result columns to chart properties. |
| Configure date range and refresh | Set the widget query period and refresh interval. |
Analysis source
Under Analysis Source in the configuration panel, select the source queried by the widget. Choose one of three types.
- Dataset: A dataset registered in D.Hub.
- Entity: An entity registered in an ontology.
- Relationship: A relationship registered in an ontology.
A widget query reads only the selected analysis source. To use another source, select it again in the configuration panel.
Available scope
The analysis-source list contains only items in the same collection as the dashboard. A source already saved on a widget remains unchanged. This scope is applied when you select the source again.
Simple Mode
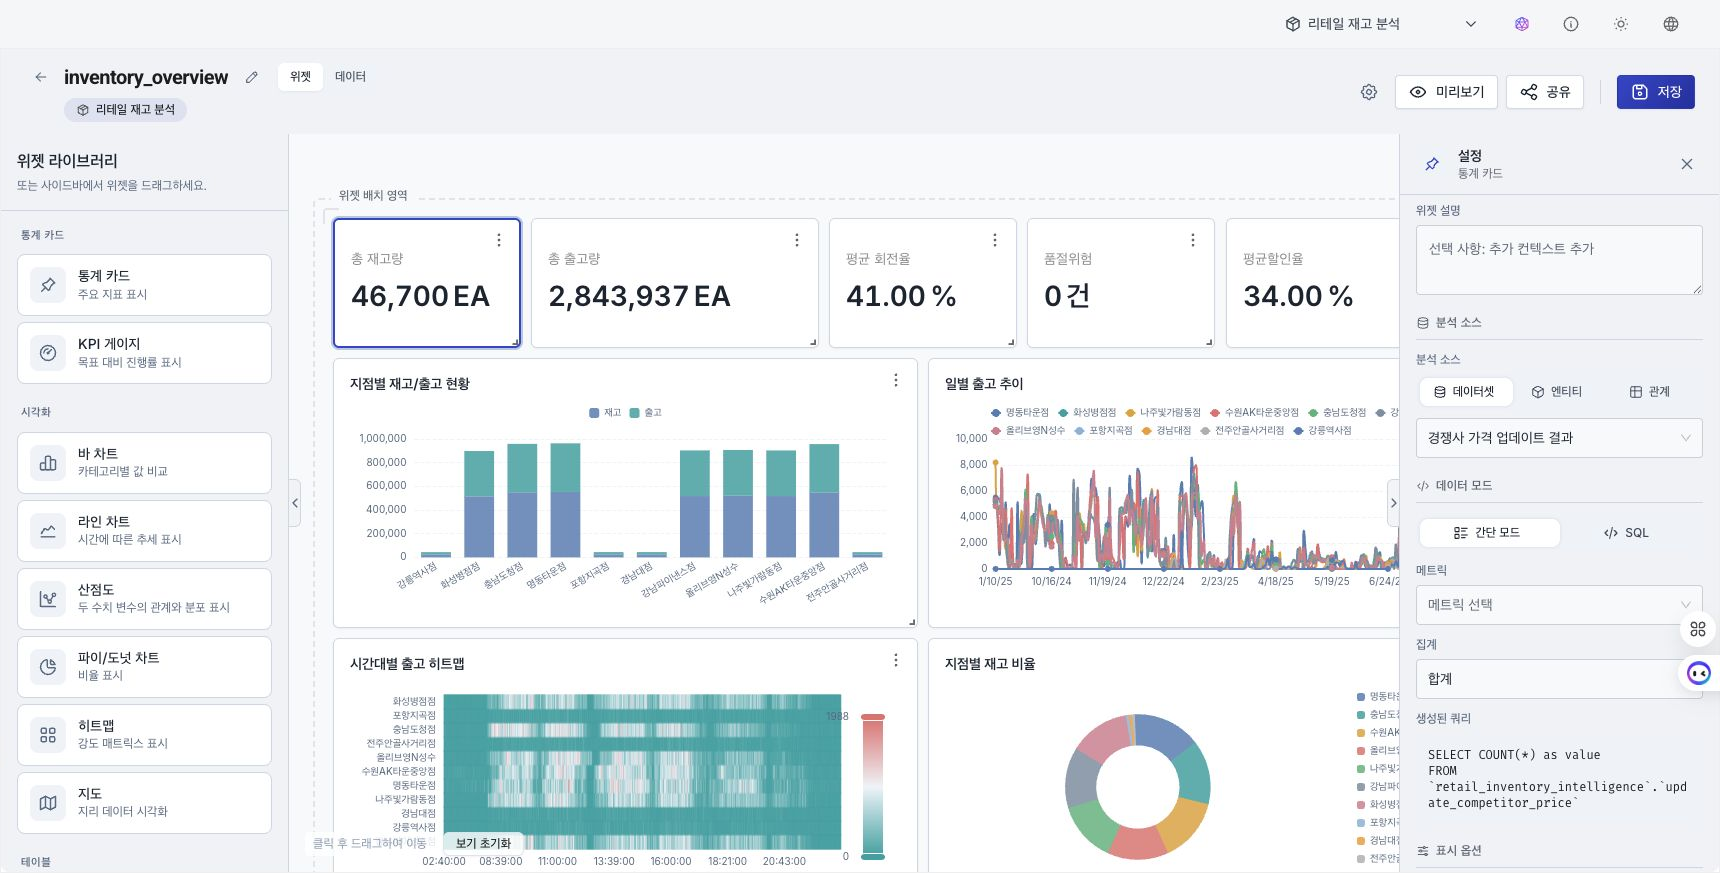
Configure Simple Mode
- Select an analysis source: Choose Dataset, Entity, or Relationship in the segmented control, then choose the source.
- Under Metric Settings, select the value field and aggregation. Supported aggregations are
SUM,AVG,COUNT,MIN, andMAX. - Under Group By, select the field used to group data. Depending on the chart type, also select fields for the X-axis and Y-axis.
Supported aggregation functions
| Function | Description | Example |
|---|---|---|
SUM | Total | Total revenue |
AVG | Average | Average order value |
COUNT | Count | Number of orders |
MIN | Minimum | Lowest price |
MAX | Maximum | Highest price |
SQL mode
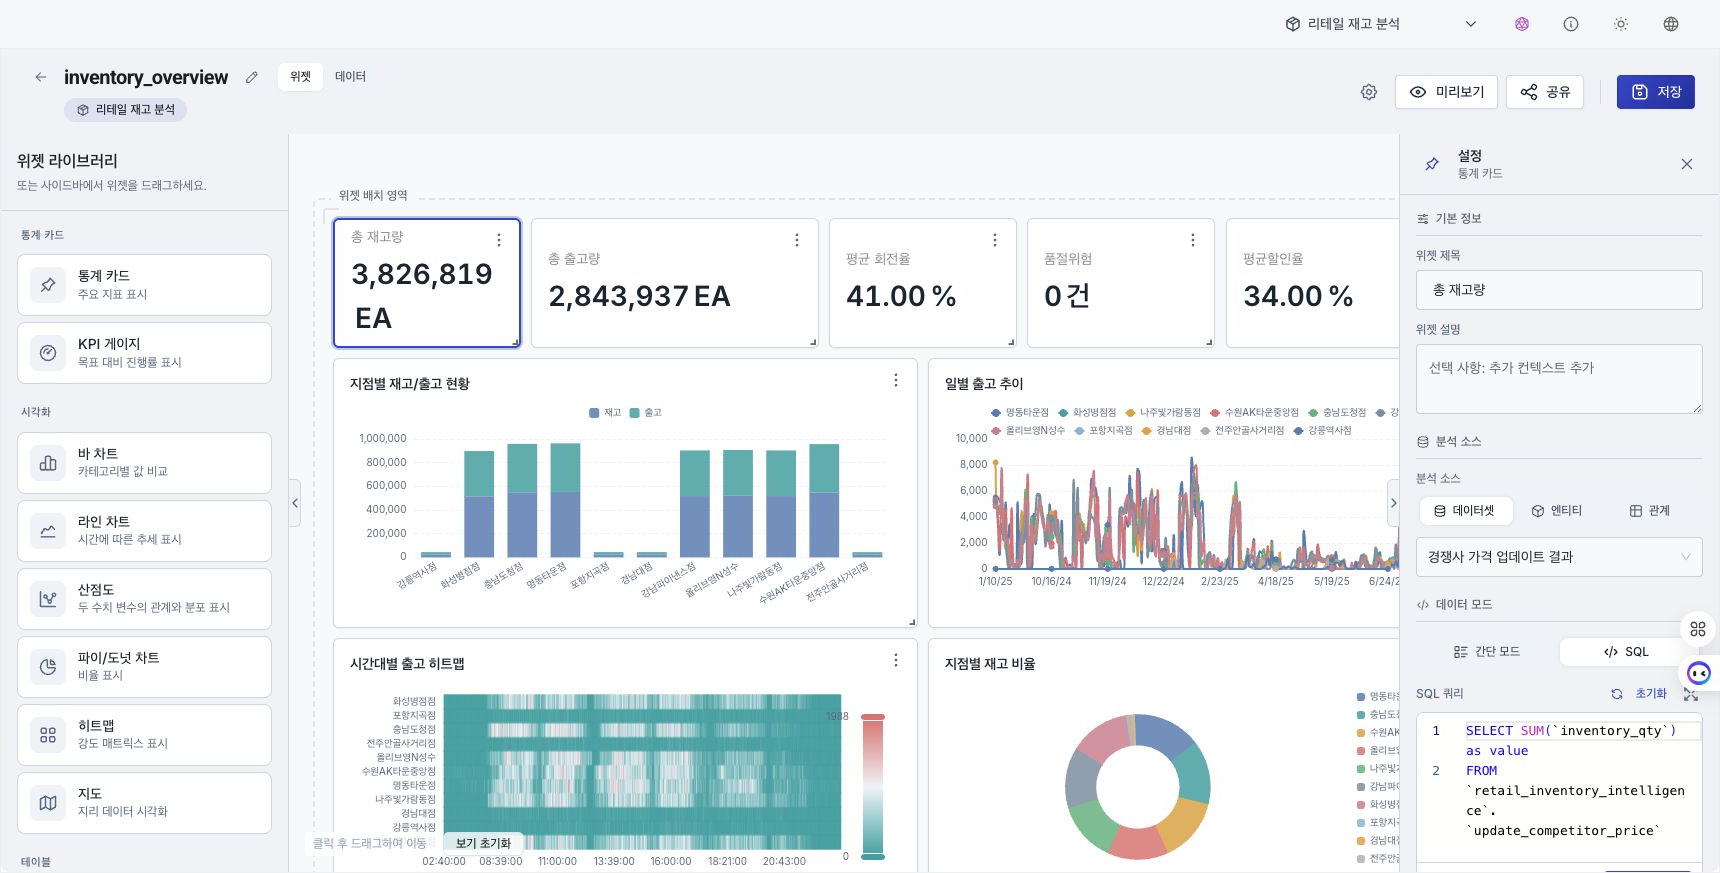
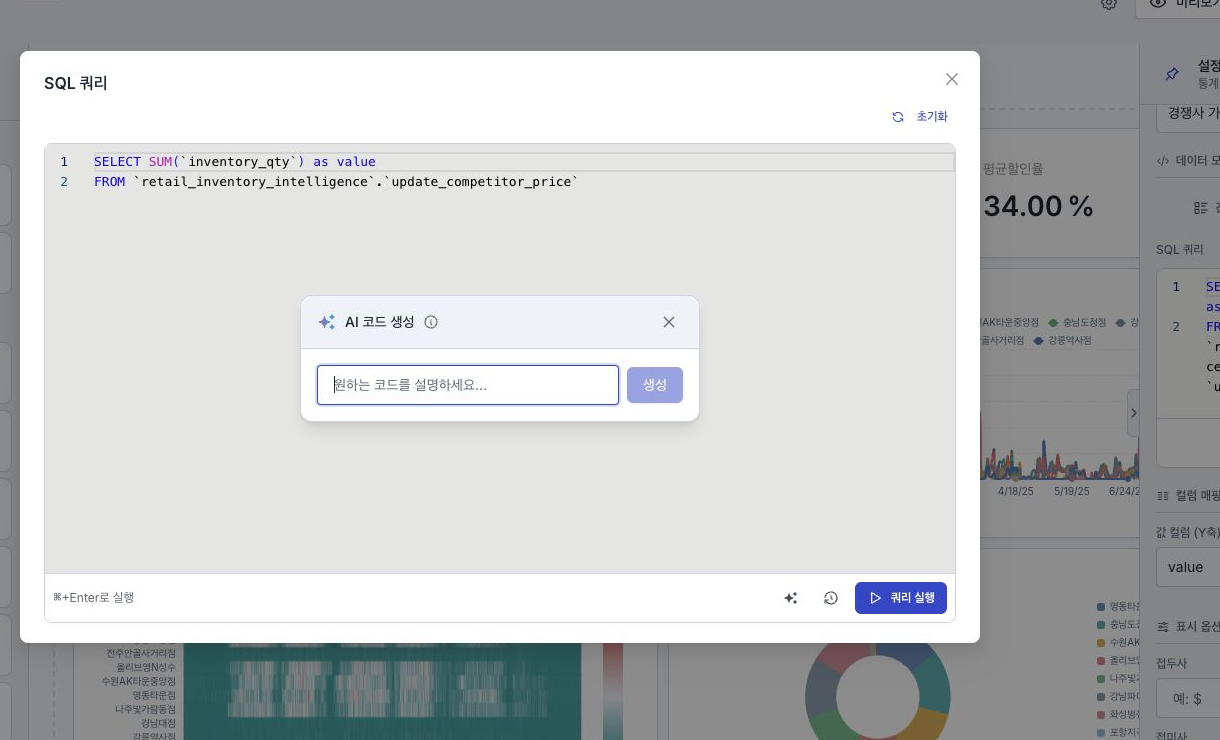
For complex transformations, write a SQL query in the SQL editor, which provides syntax highlighting and autocomplete.
Basic use
- Change Data mode to
SQL. - Write a query in the SQL editor. It supports syntax highlighting, dataset-column autocomplete, line numbers, execution with
⌘Enter(macOS) /Ctrl+Enter(Windows), and query history. OnlySELECTstatements can run. - Select Test query to preview the result. Execution time and returned row count appear.
- Map result columns to chart properties such as the X-axis and Y-axis.
SQL mode still reads only the selected analysis source. An error appears before execution if no source is selected or the query references another source.
Reference a table as db.table, including the database name. Entering only a table name produces an error before query testing. When converting from Simple Mode or selecting Reset, the full path of the selected analysis source is inserted into the SQL automatically.
Expanded SQL editor
If the configuration panel is too narrow, select Expand SQL editor next to the SQL label.
- The expanded editor provides the same edit, reset, test, result, and error controls as the narrow panel.
- Closing it synchronizes the contents back to the narrow editor.
- Automatic expansion for AI: Running AI from the narrow editor opens the expanded editor. The selection and draft content are preserved.
Reset SQL
Select Reset next to the SQL label to regenerate the current SQL from the Simple Mode settings.
- If Simple Mode is empty, a basic template is created from the dataset structure using the first column for the required type.
- If a DRS date range and date-filter column are configured, the reset SQL includes the same date condition.
AI code generation and AI editing
SQL mode uses the same inline AI flow as the code editor.
- Inline AI: Press
⌘I(macOS) /Ctrl+I(Windows) to open a natural-language input for generating or revising SQL. Open global search with⌘K(macOS) /Ctrl+K(Windows). - Edit selection: Select part of the SQL to ask AI to revise only that section.
- Insert / Cancel: Review the proposed SQL, then select Insert to apply it or Cancel to discard it.
- Analysis-source context: AI uses the selected source's table and column names and types when suggesting SQL.
Synchronization between Simple Mode and SQL
When switching from Simple Mode to SQL, the selected dataset, fields, and aggregation are converted to SQL. When returning to Simple Mode after editing SQL, only convertible settings are applied; the rest appear in an informational message.
Query examples
In these examples, analytics is the database name. In an actual query, use the database name shown in the SQL for the selected analysis source.
-- Total revenue by category
SELECT
    category,
    SUM(amount) as total
FROM `analytics`.`sales_data`
GROUP BY category
ORDER BY total DESC

-- Daily order trend
SELECT
    toDate(order_date) as date,
    COUNT(*) as order_count,
    SUM(amount) as revenue
FROM `analytics`.`orders`
GROUP BY date
ORDER BY date

-- Traffic by hour
SELECT
    toHour(timestamp) as hour,
    COUNT(*) as visits
FROM `analytics`.`page_views`
WHERE toDate(timestamp) = today()
GROUP BY hour
ORDER BY hour
SQL functions
See the SQL reference for supported functions and examples.
| Function | Description | Example |
|---|---|---|
toDate() | Convert to date | toDate(timestamp) |
toHour() | Extract hour | toHour(timestamp) |
today() | Today's date | WHERE date = today() |
yesterday() | Yesterday's date | WHERE date = yesterday() |
toStartOfWeek() | Start of week | toStartOfWeek(date) |
toStartOfMonth() | Start of month | toStartOfMonth(date) |
formatDateTime() | Format a date | formatDateTime(date, '%Y-%m') |
Global date range
Set the dashboard-wide query period with the Date Range Selector (DRS) in the top toolbar. A widget uses this period if it does not specify its own time column or range. Configure the widget separately to use a different period.
Configure the range
- In the DRS above the canvas, select a preset such as Last 7 days or Last 30 days, or select a Custom range.
- If a time column is inferred in a widget's data settings, DRS applies without further configuration.
- If no time column is found, select one under Date filter column in the widget data settings.
Apply the date range in Simple Mode
In Simple Mode, the DRS range is applied when a time column is identified. For a widget whose time column cannot be inferred, select Date filter column manually. The SQL preview for a widget with the range applied displays DRS time range applied automatically.
Date-range lock and automatic refresh
- Selecting a Custom range in DRS disables automatic refresh.
- Automatic refresh runs only for a preset relative range such as Last 7 days.
Apply the date range in SQL mode
In SQL mode, select a Date filter column in the widget settings. When the DRS range changes, the query period is updated using that column.
SQL mode does not select a time column automatically. To apply the DRS range, select a Date filter column manually.
Refresh data
Refresh dashboard data with automatic refresh or manual refresh. Both methods query every widget again.
Automatic refresh
- Configure the interval: Use Automatic refresh in the dashboard preview toolbar or the editor's Settings dialog. Options are Disabled / 30 seconds / 1 minute / 5 minutes / 10 minutes / 30 minutes.
- Refresh indicator: The clock icon under Automatic refresh rotates while data is refreshing.
- Save and apply: A value changed in the preview toolbar applies immediately. A value changed in the editor's Settings dialog applies from the next preview.
Manual refresh
Select Refresh in the preview toolbar to query every widget immediately. A Data refreshed notification appears. Manual refresh works regardless of the DRS lock.
When the date range is locked
Selecting a Custom range in DRS disables automatic refresh. Hover over Automatic refresh to see a message asking you to choose a relative range such as Last 7 days.