FDE Start (Resource Configuration Workflow Guide)
This is a comprehensive onboarding guide for Forward Deployed Engineers (FDE) and development teams who design tailored solutions at client sites using the D.Hub2 platform — covering data collection, ontology, pipelines, AI agents, and dashboard visualization, and how to assemble the key resources organically.
Follow the visual interface and actual screenshot flow on the portal to assemble resources step by step.
1. Collection Management details
A collection is the most fundamental and essential workspace in the D.Hub2 platform for isolating resources and separating logical workspaces.
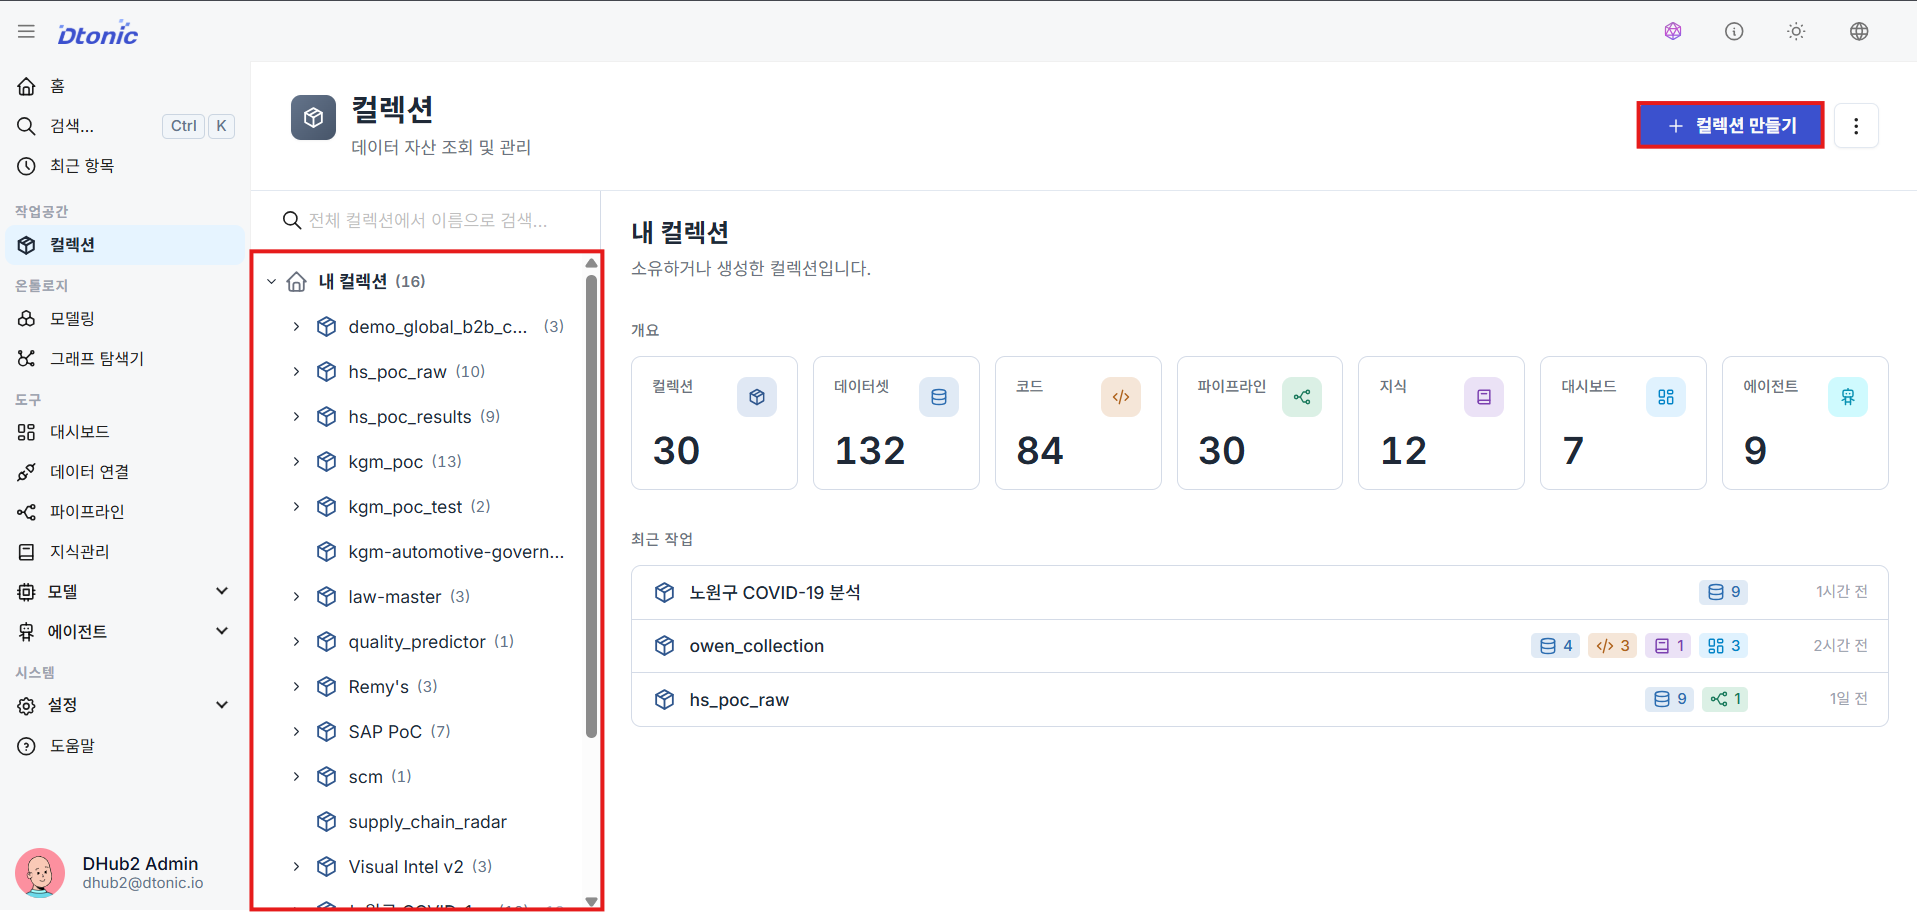
① View and Create My Collections
Navigate to Workspace → Collection Explorer in the sidebar to see all collections you own at a glance. Click the Create Collection button in the upper right to begin adding a new collection.
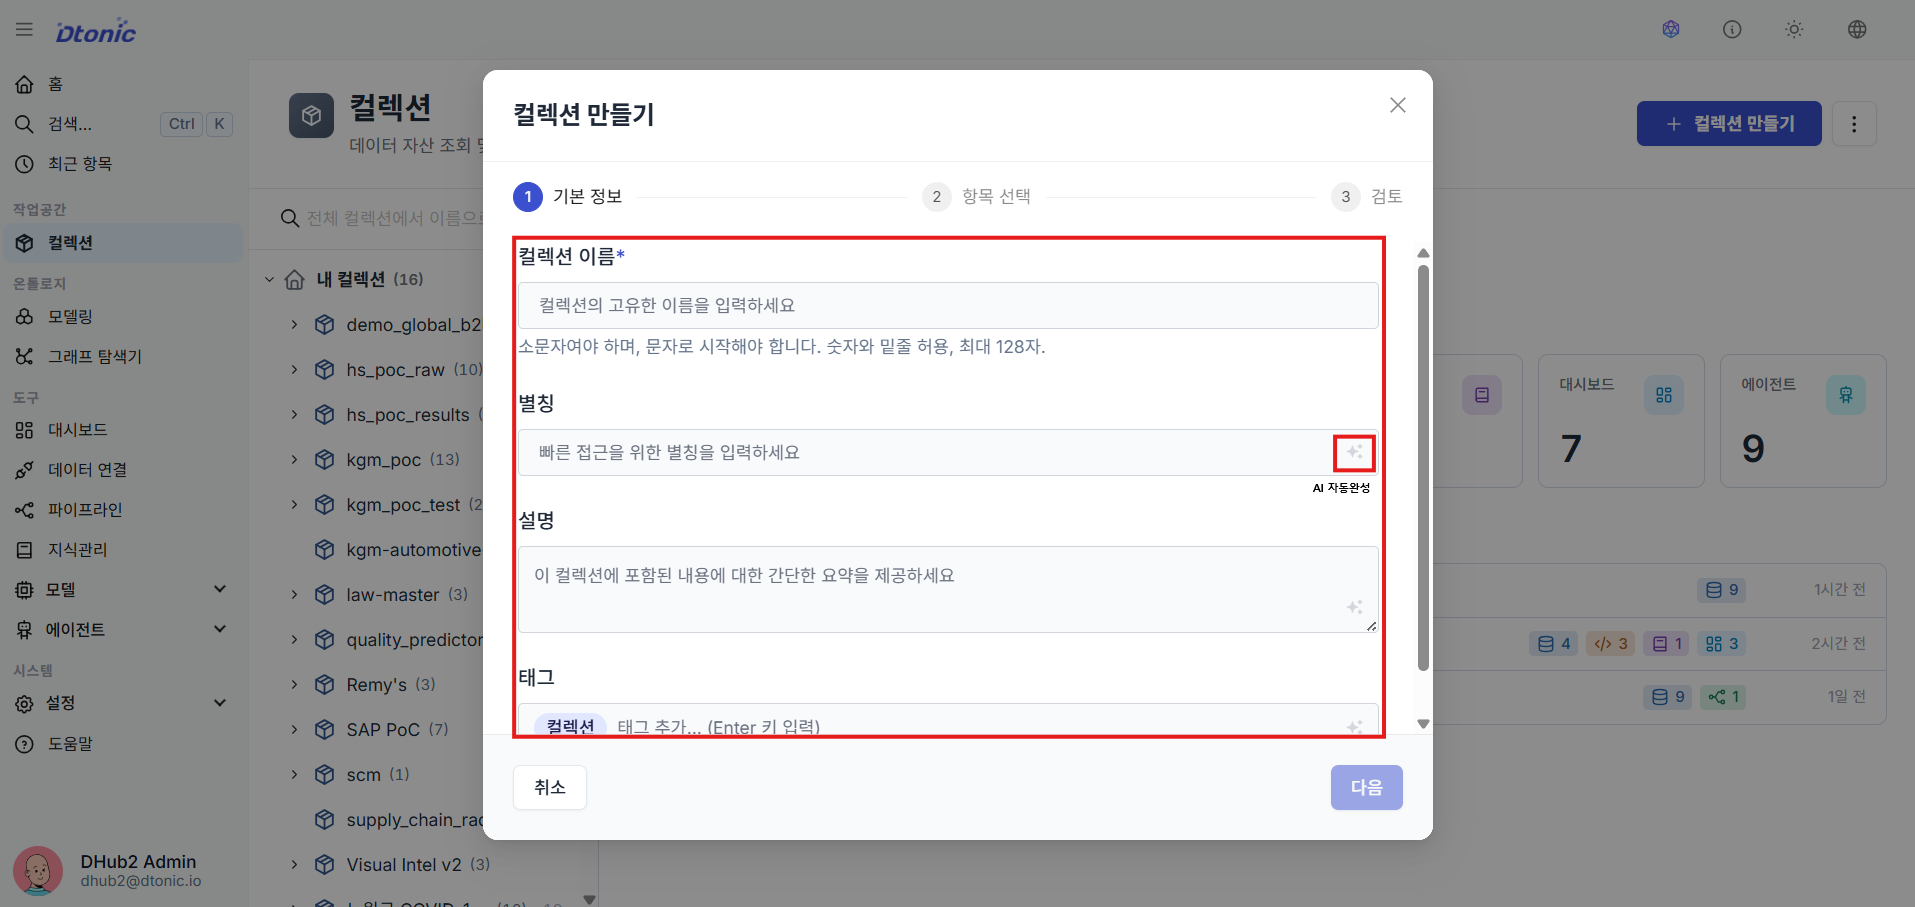
② Enter Collection Metadata
In the collection creation dialog, enter a unique name, display alias, description, and tags to configure the collection metadata. You can also use the star-shaped AI autocomplete button next to each input field to quickly draft an alias, description, or tags based on the name or description you've already written.
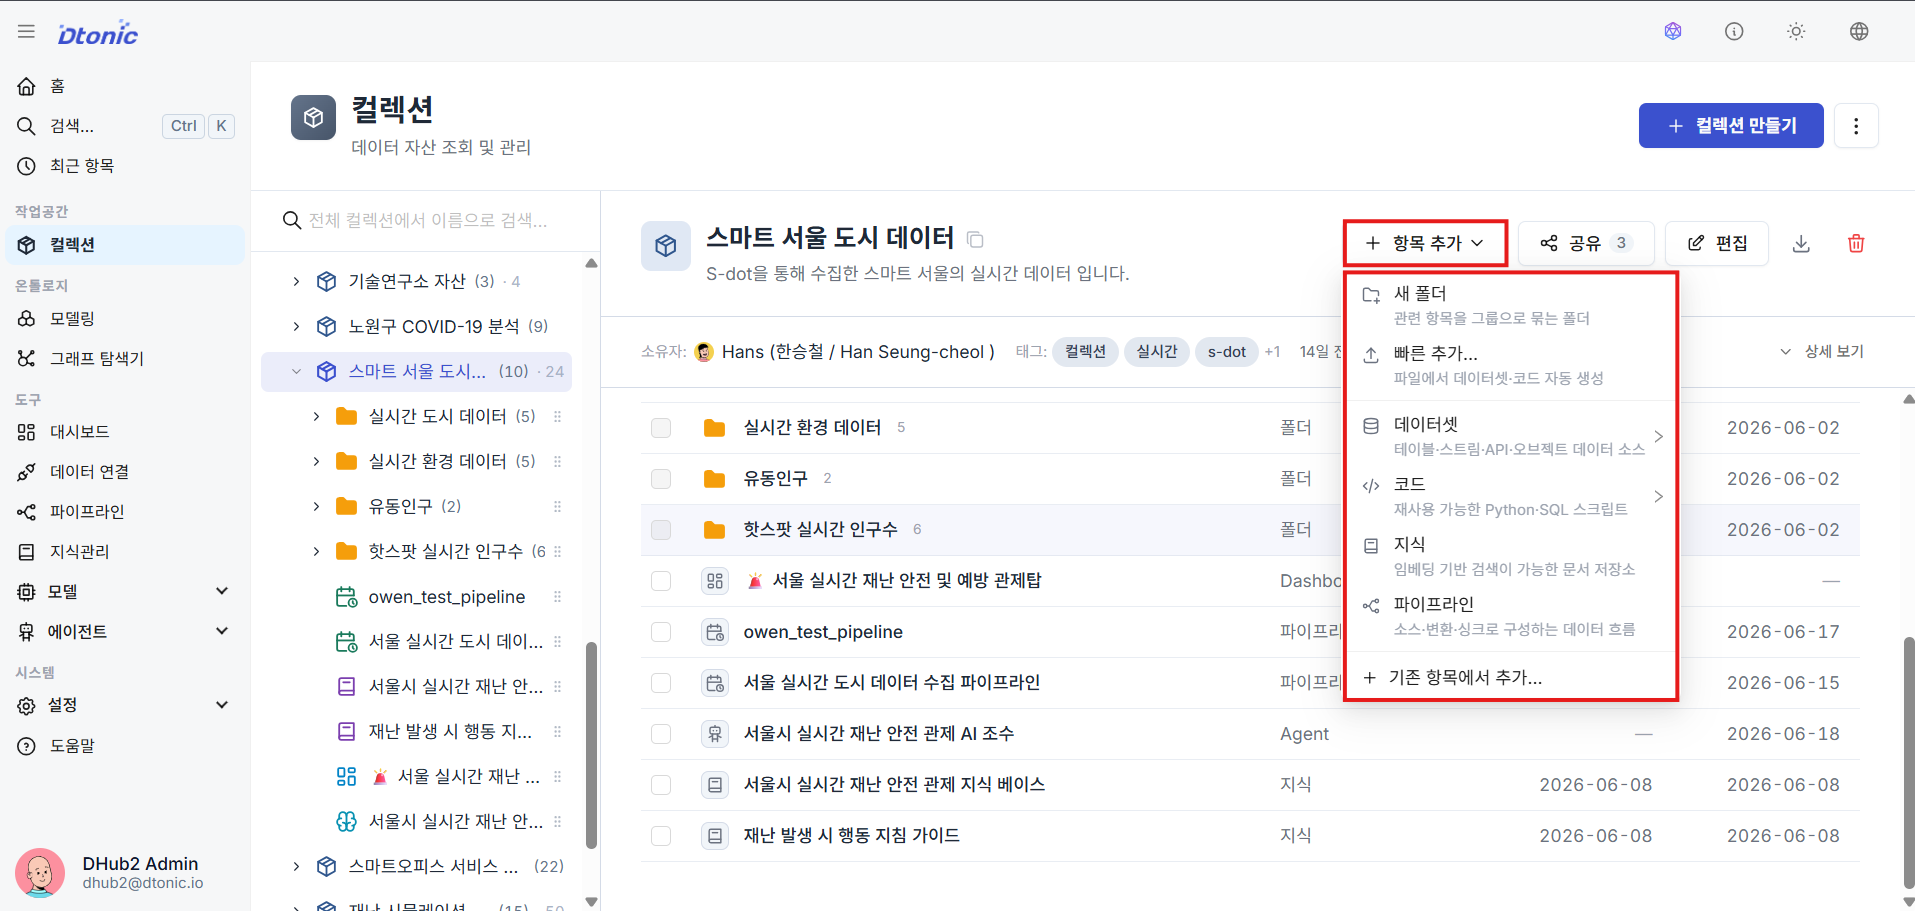
③ Add Resources to a Collection
Click the Add Item button at the top of the collection tree or via the right-click menu to create and add key resources — such as datasets, code, knowledge bases, and pipelines — that belong within that collection's scope.
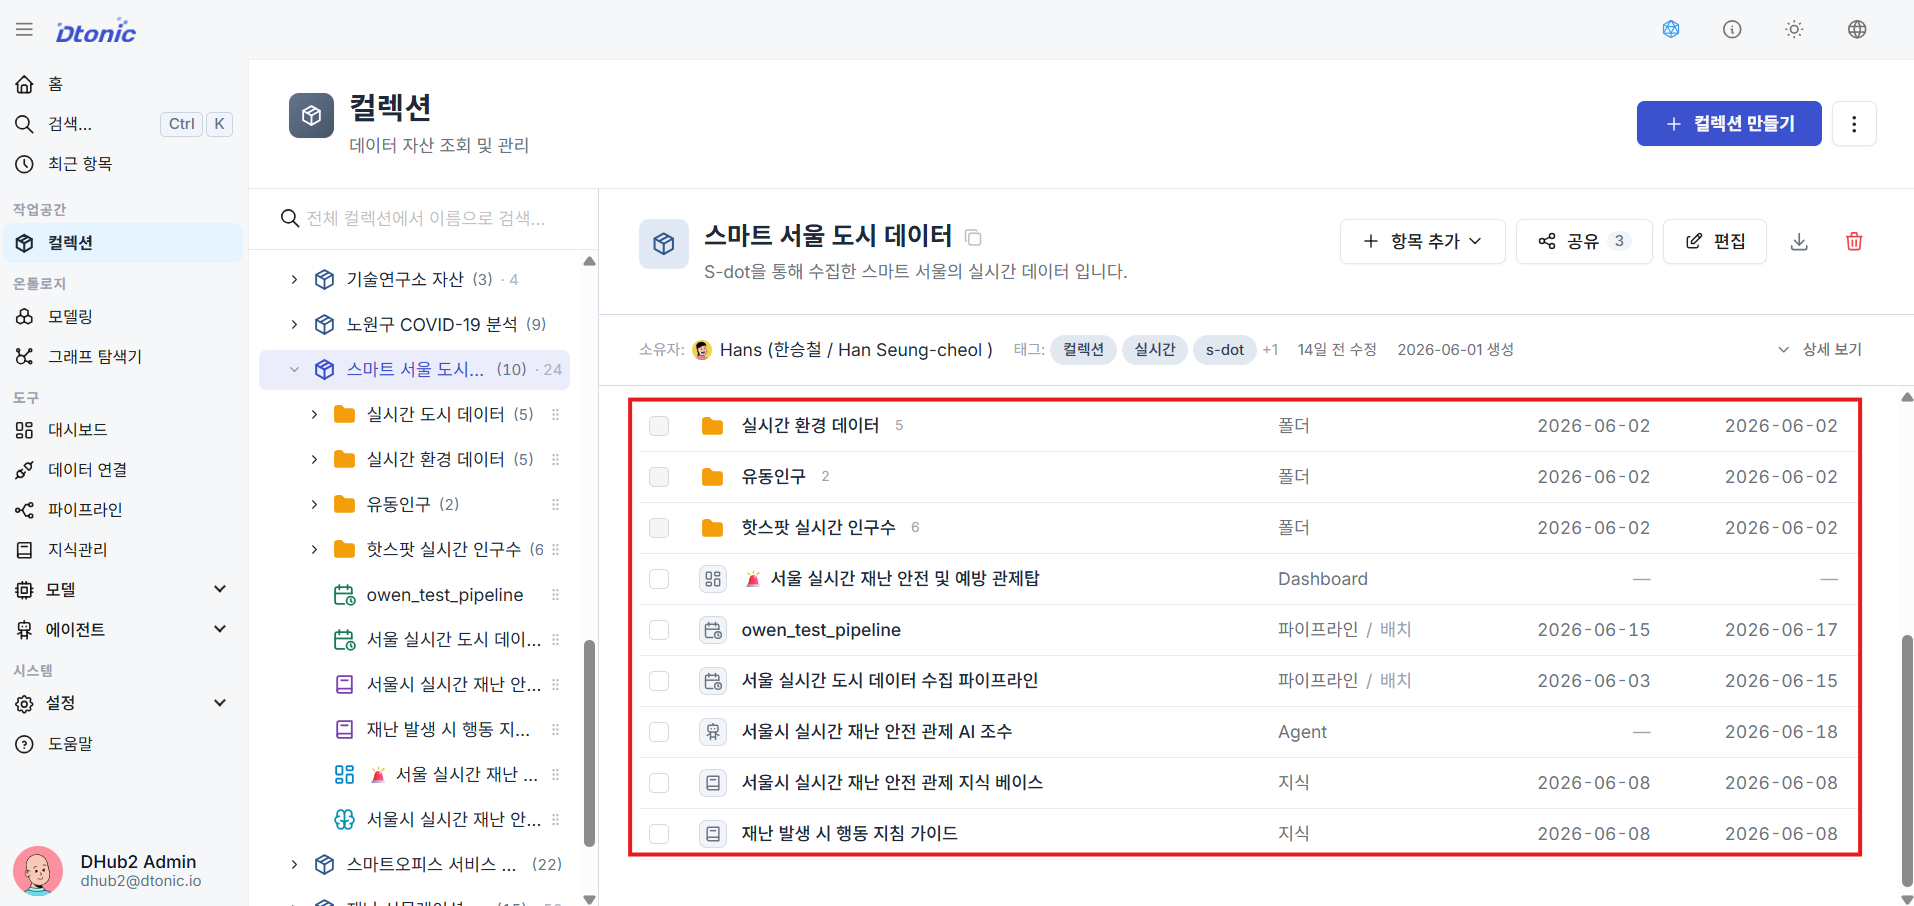
④ Check Resources Belonging to a Collection
Select or expand a collection to immediately see the types and arrangement of all sub-resources that are isolated and managed under it.
2. Ontology Modeling details
Design the semantic network of a knowledge graph by organically connecting multidimensional raw data.
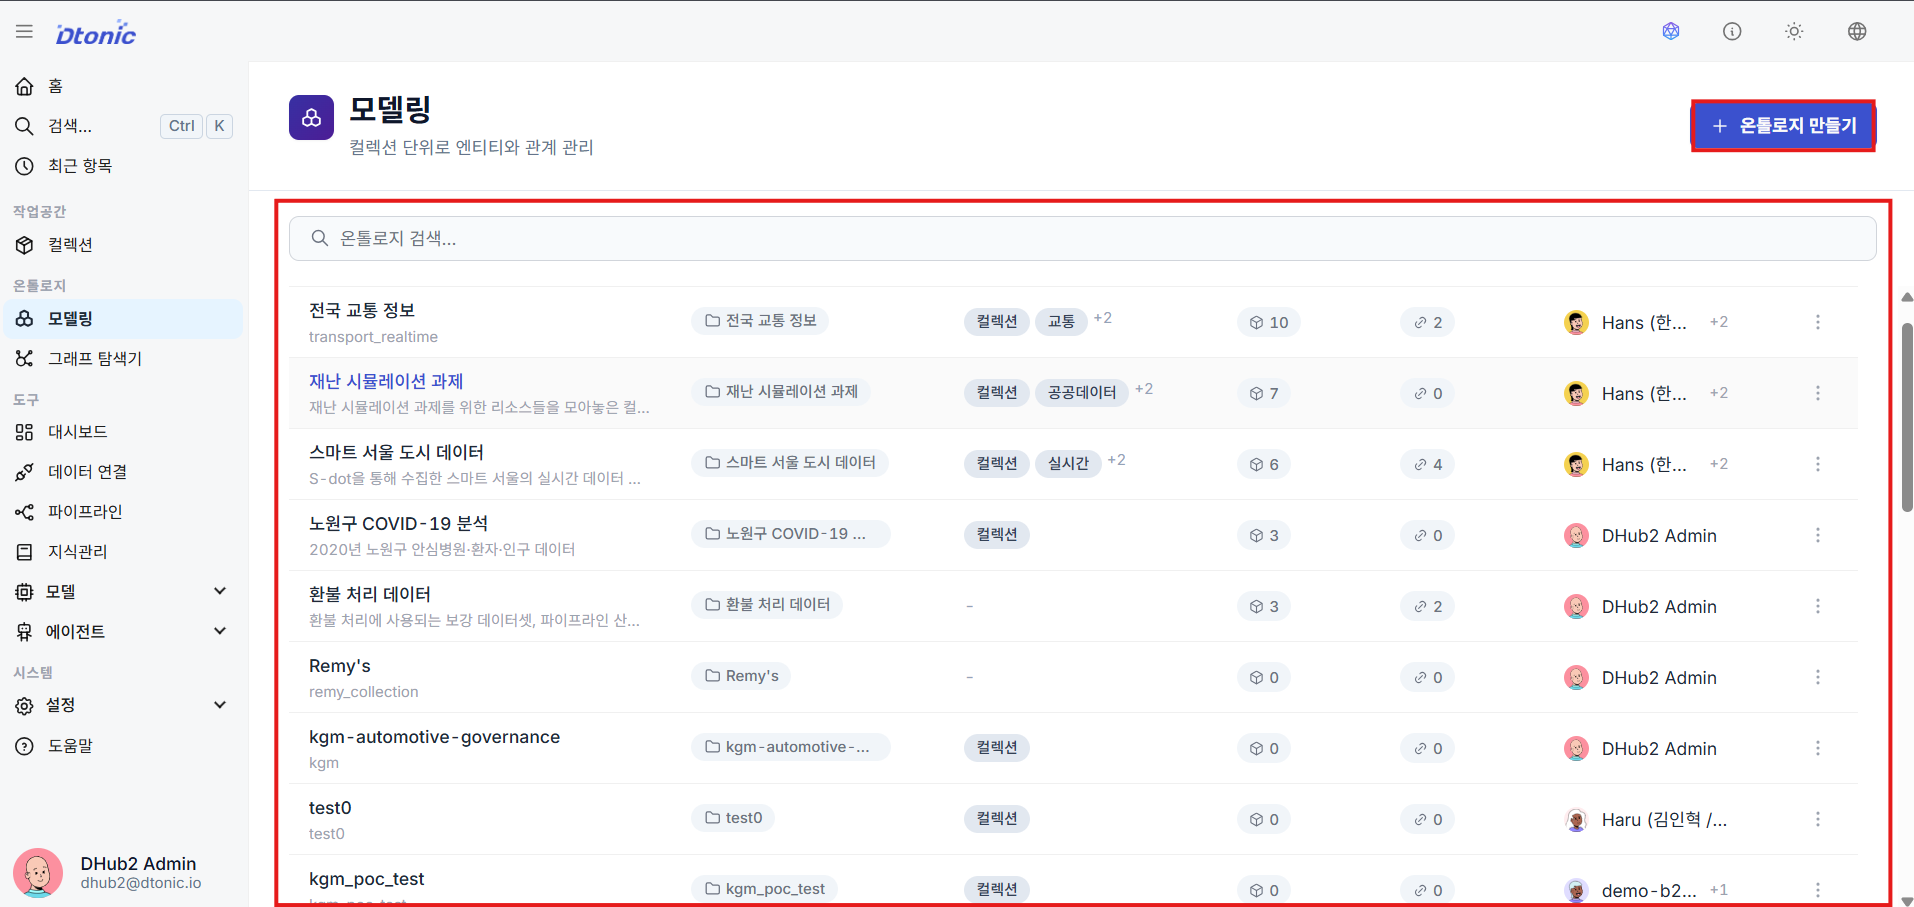
⑤ View the Ontology List
Click the Modeling menu under the Ontology group in the sidebar to see a list of defined ontologies and their mapped collections.
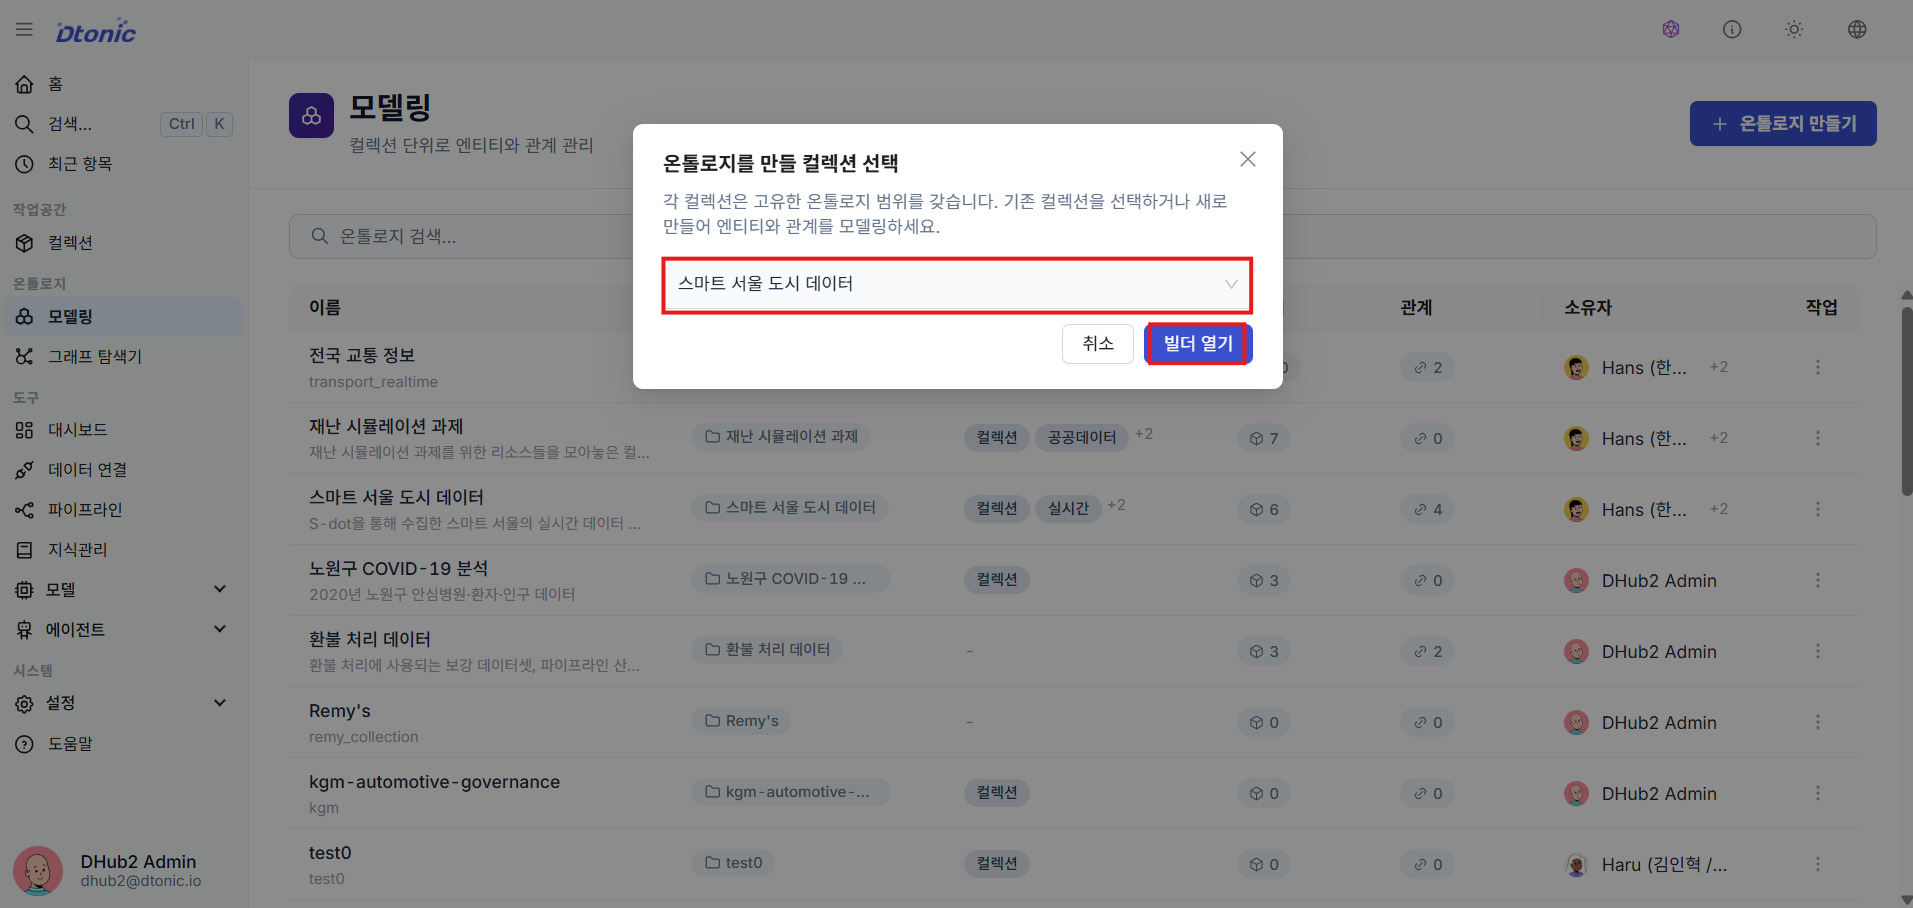
⑥ Enter the Ontology Builder (Collection Required)
To begin new ontology modeling, select the target collection in the upper right (required), then click the Open Builder button.
⑦ Ontology Builder Screen
The ontology builder, a visual graph design environment, opens. Here you can create entity and relationship nodes and connect them by dragging edges.
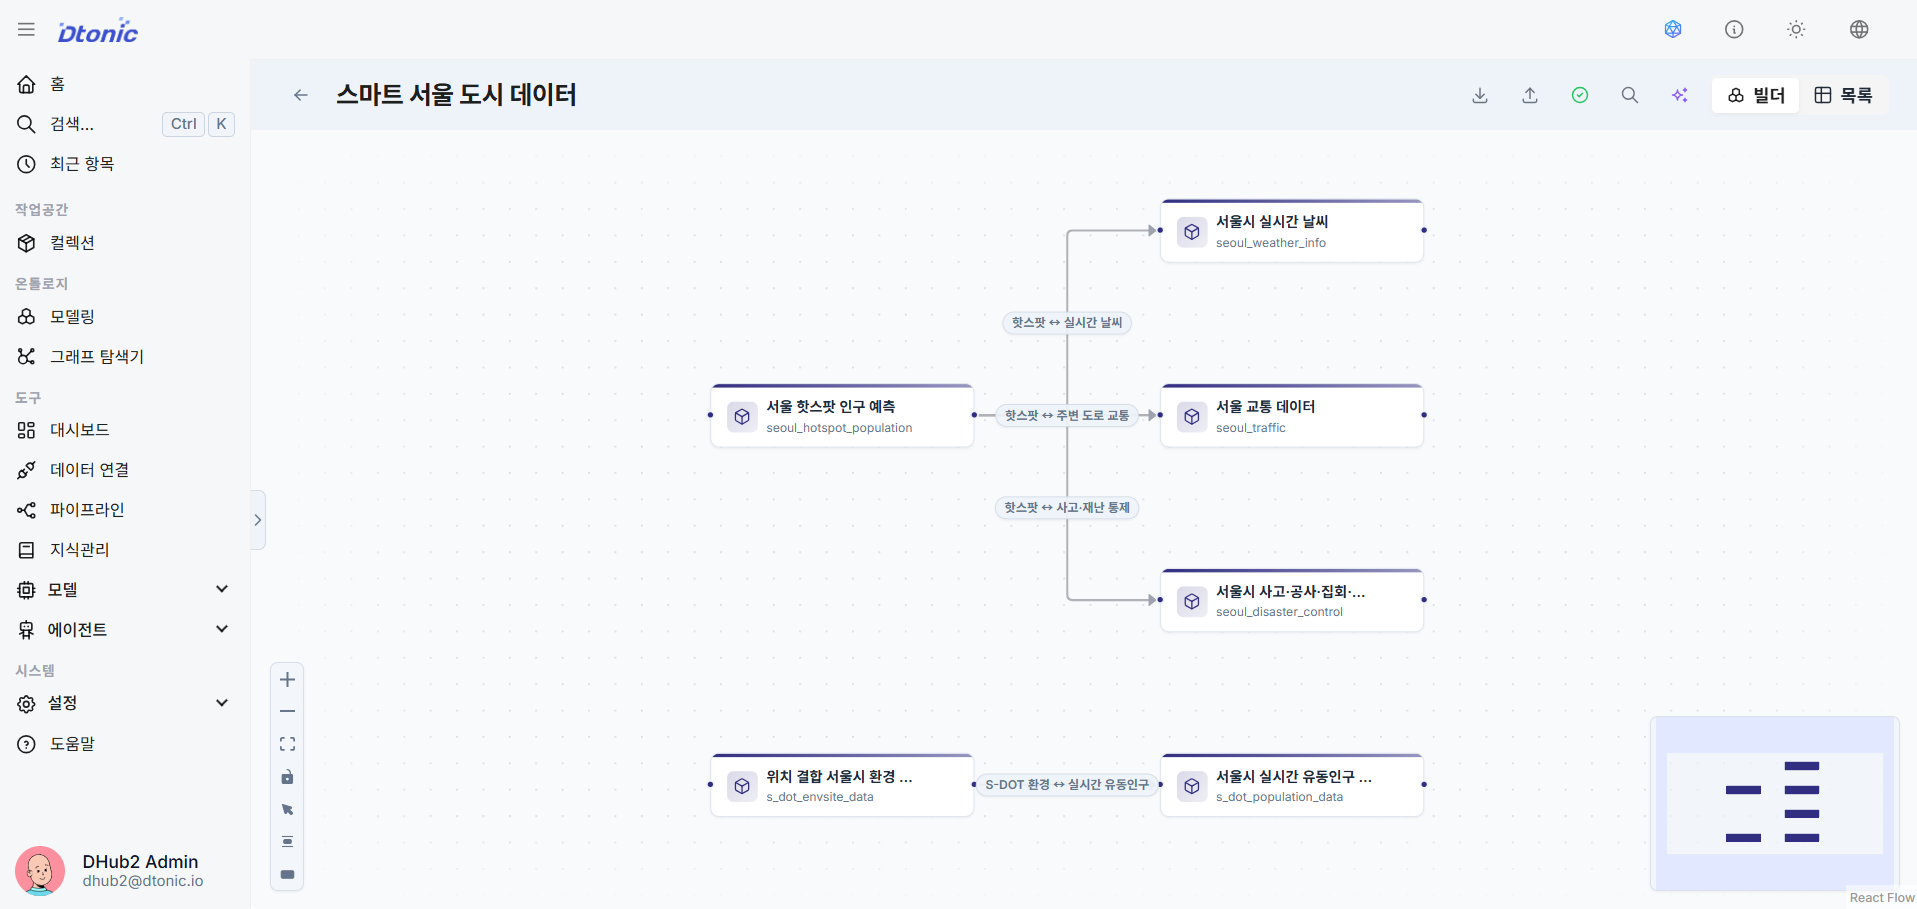
⑧ Create Entities and Relationships
Use the list panel on the left and the control bar at the top to define the Entity and Relationship structures that form the backbone of the ontology. These definitions are rendered on the canvas.
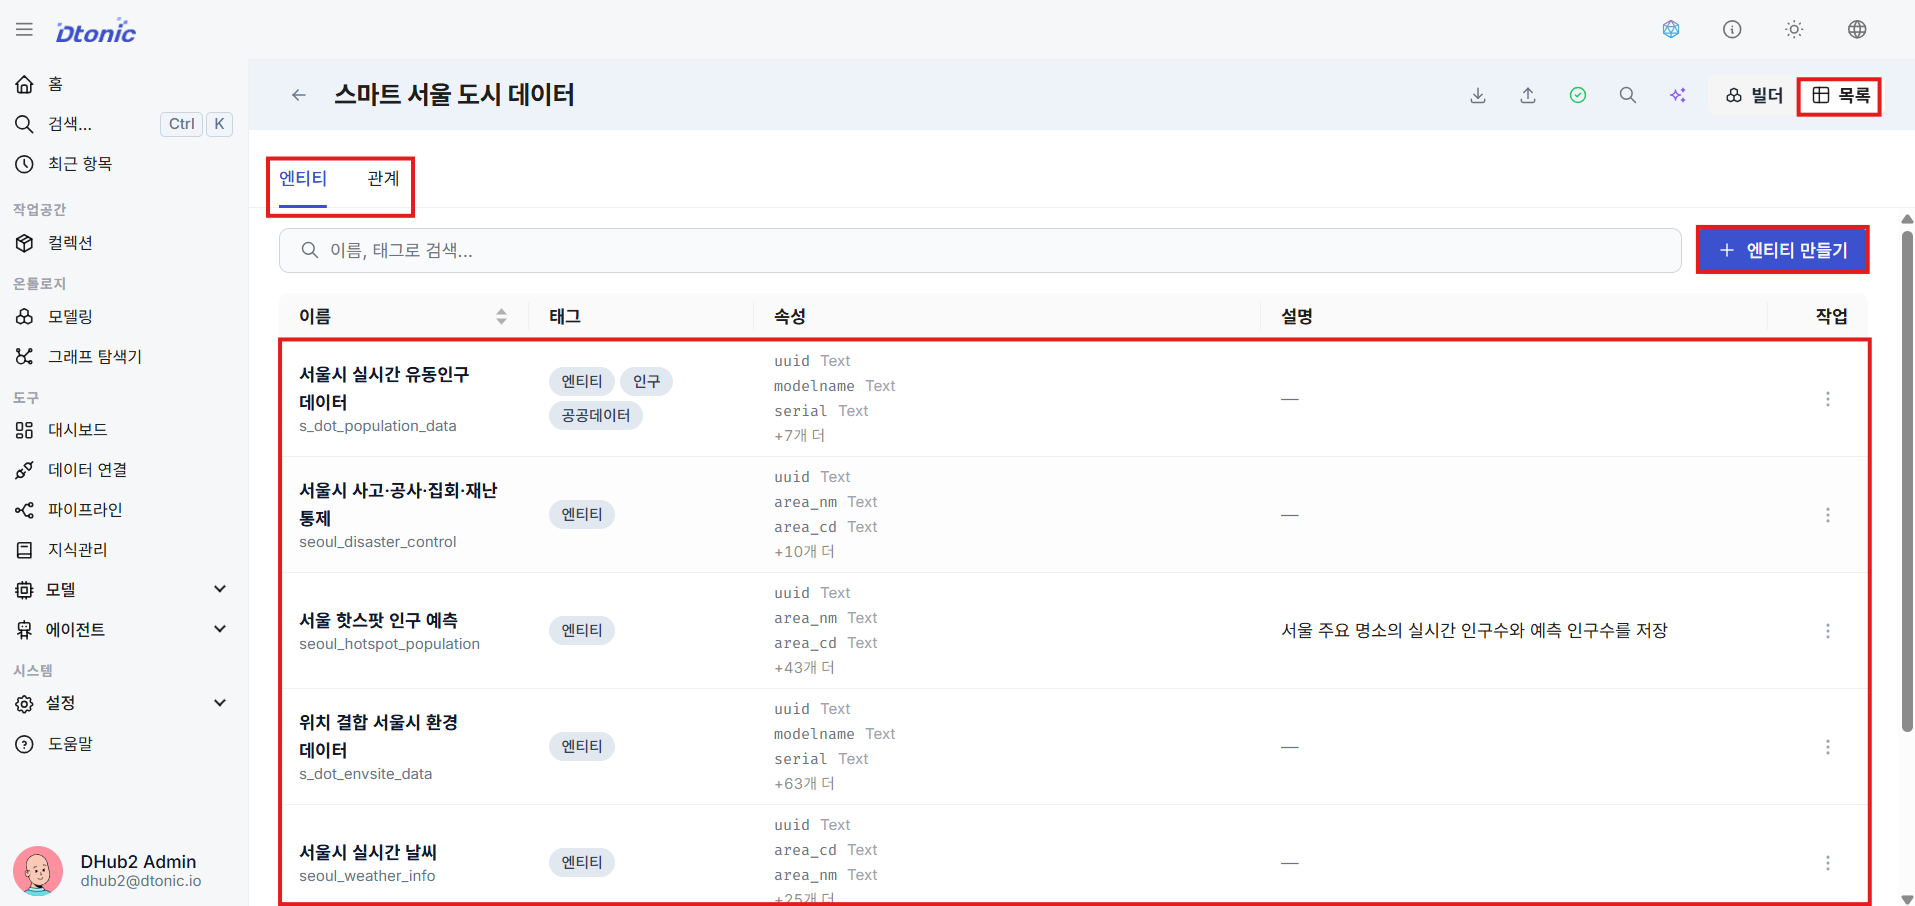
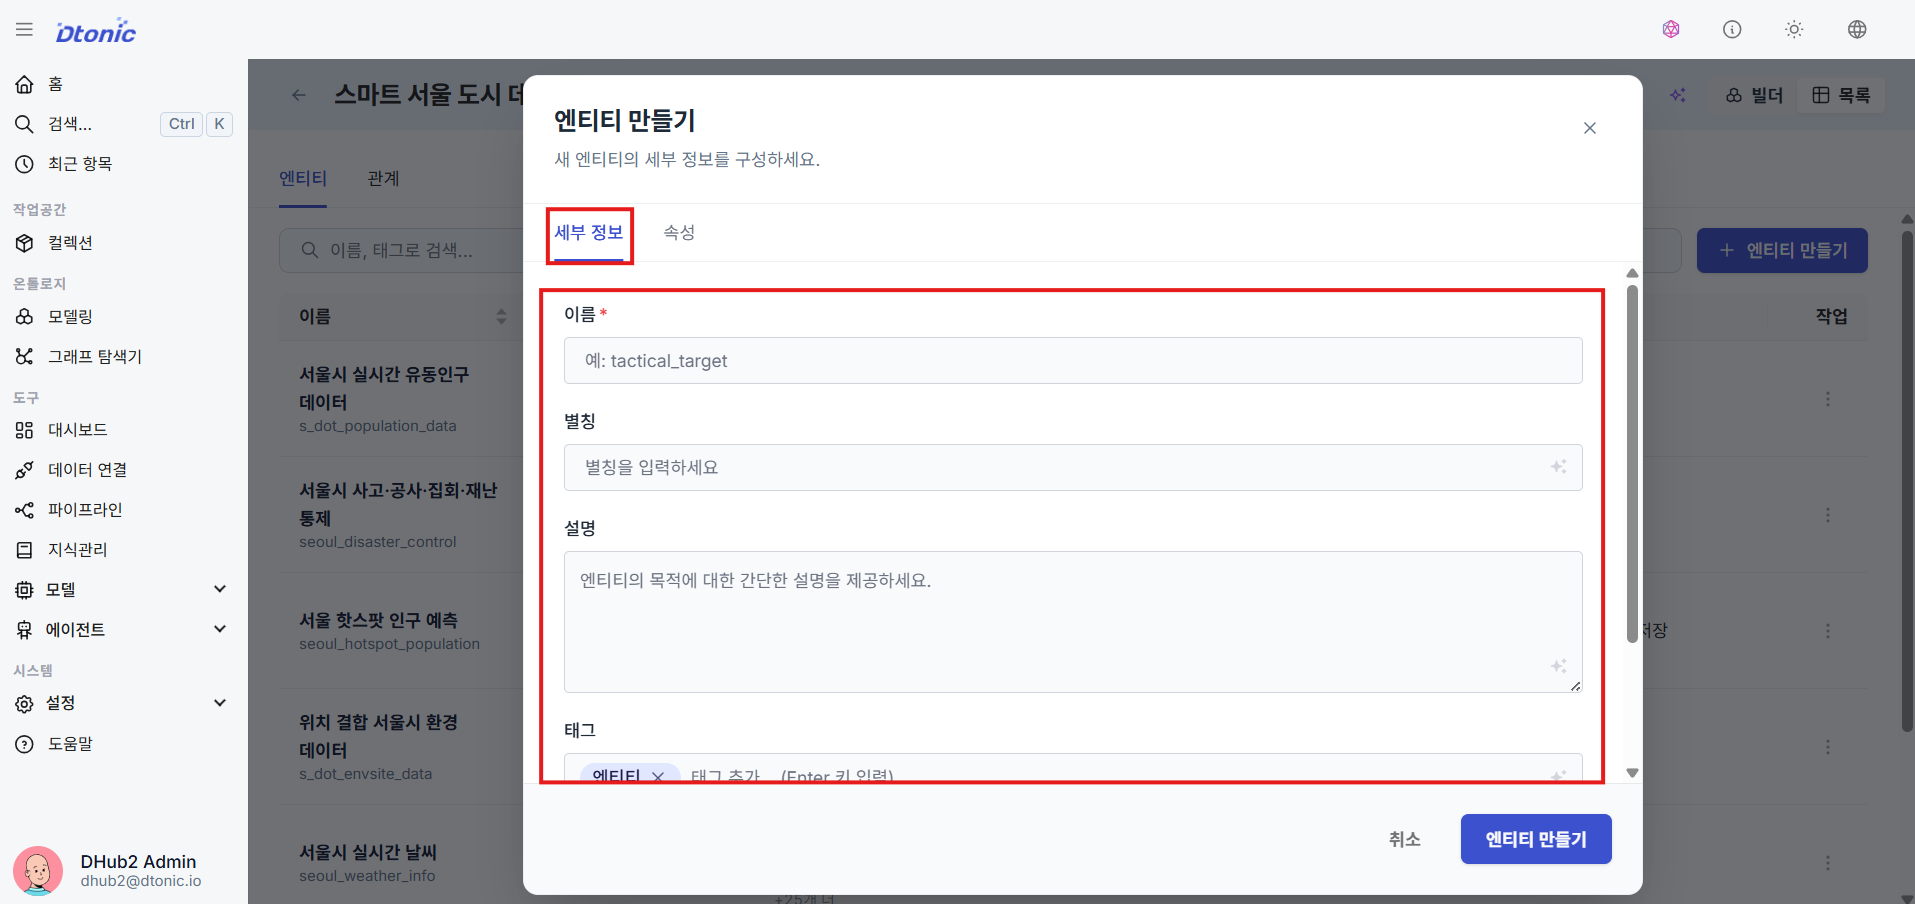
⑨ Enter Basic Entity Information
Enter the basic information for the added entity: name, display alias, description, and tags.
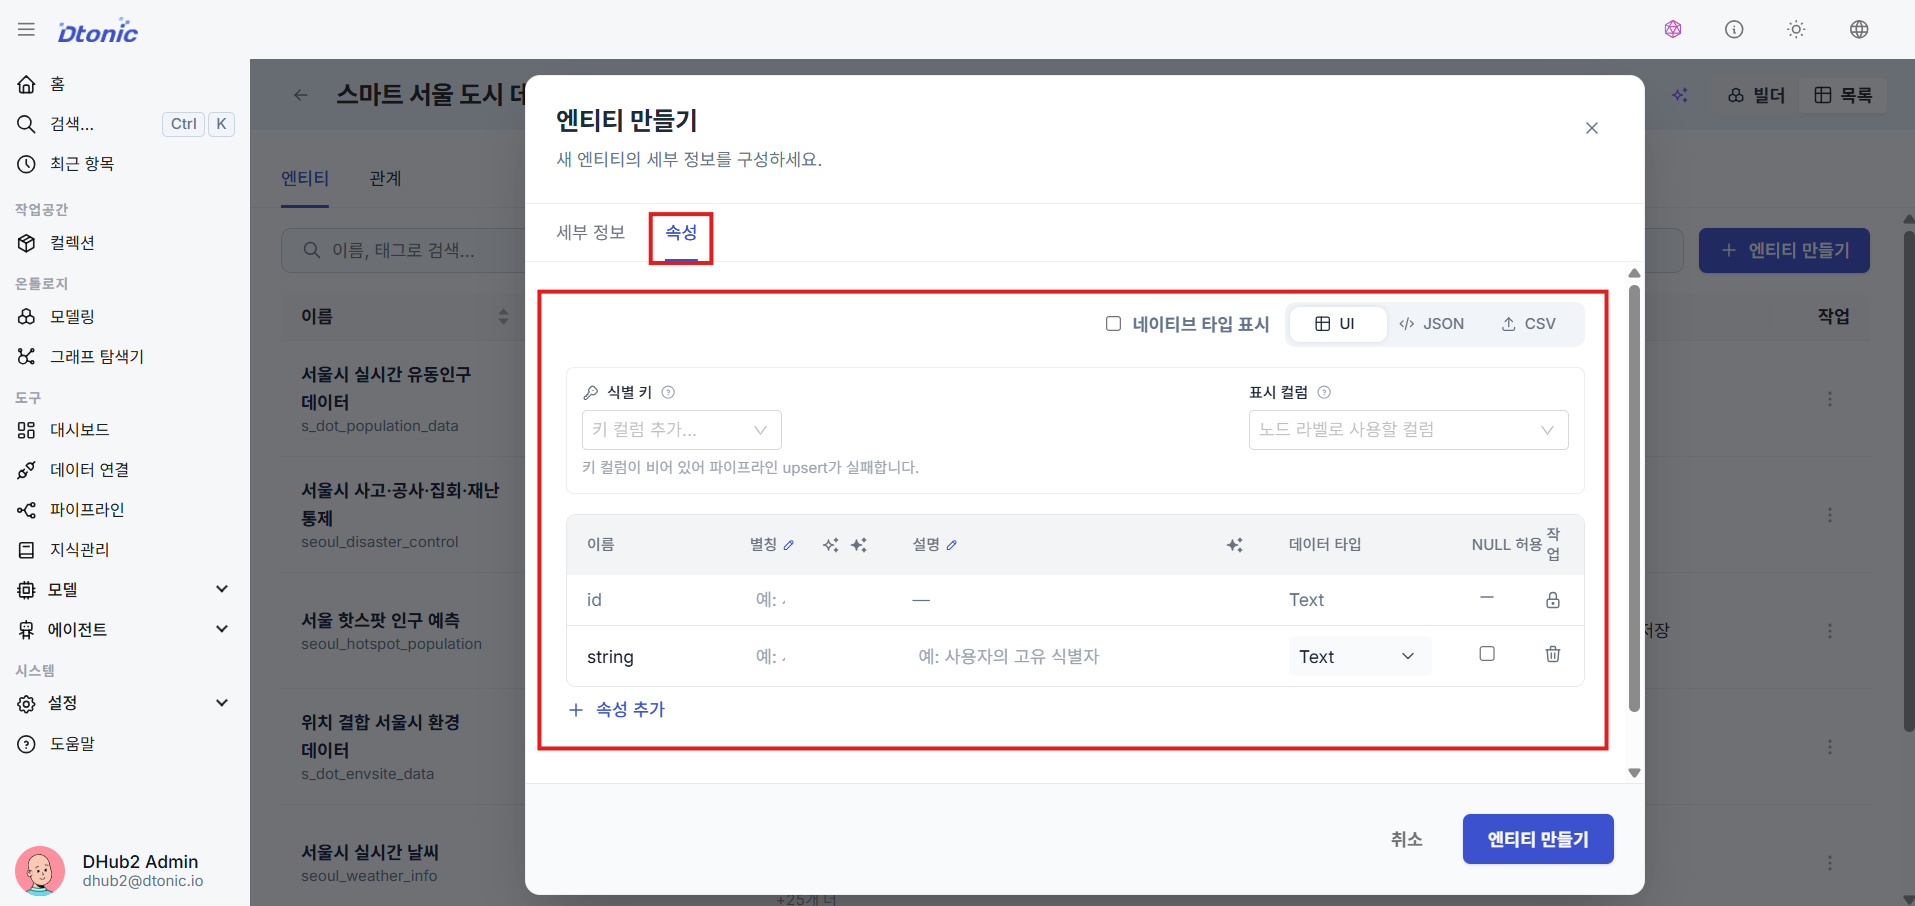
⑩ Specify Identity Keys and Define Attributes
Set Identity Keys to ensure data uniqueness and prevent duplicate ingestion. Multiple attributes can be combined into a Composite Key based on business requirements. Also define the data type and description for each attribute the entity will contain.
- Entity & Relationship (Ontology): Ontology entity/relationship data is first loaded into per-collection schema tables in the
ontologydatabase in PostgreSQL to ensure transactional consistency and integrity — this is the Source of Truth. It is then updated in Delta Lake/ClickHouse analytics tables and the Neo4j graph query path via a CDC-based sync pipeline. - Source Datasets: Source datasets are permanently stored in Delta Lake (S3/MinIO-based object storage) in table format for ACID transactions and large-scale processing, and are registered as ClickHouse DeltaLake engine tables for querying and analytics.
3. Building and Processing Data Pipelines (Pipeline Ingestion) details
Build ETL pipelines that transform raw data and push it into datasets and the ontology graph.
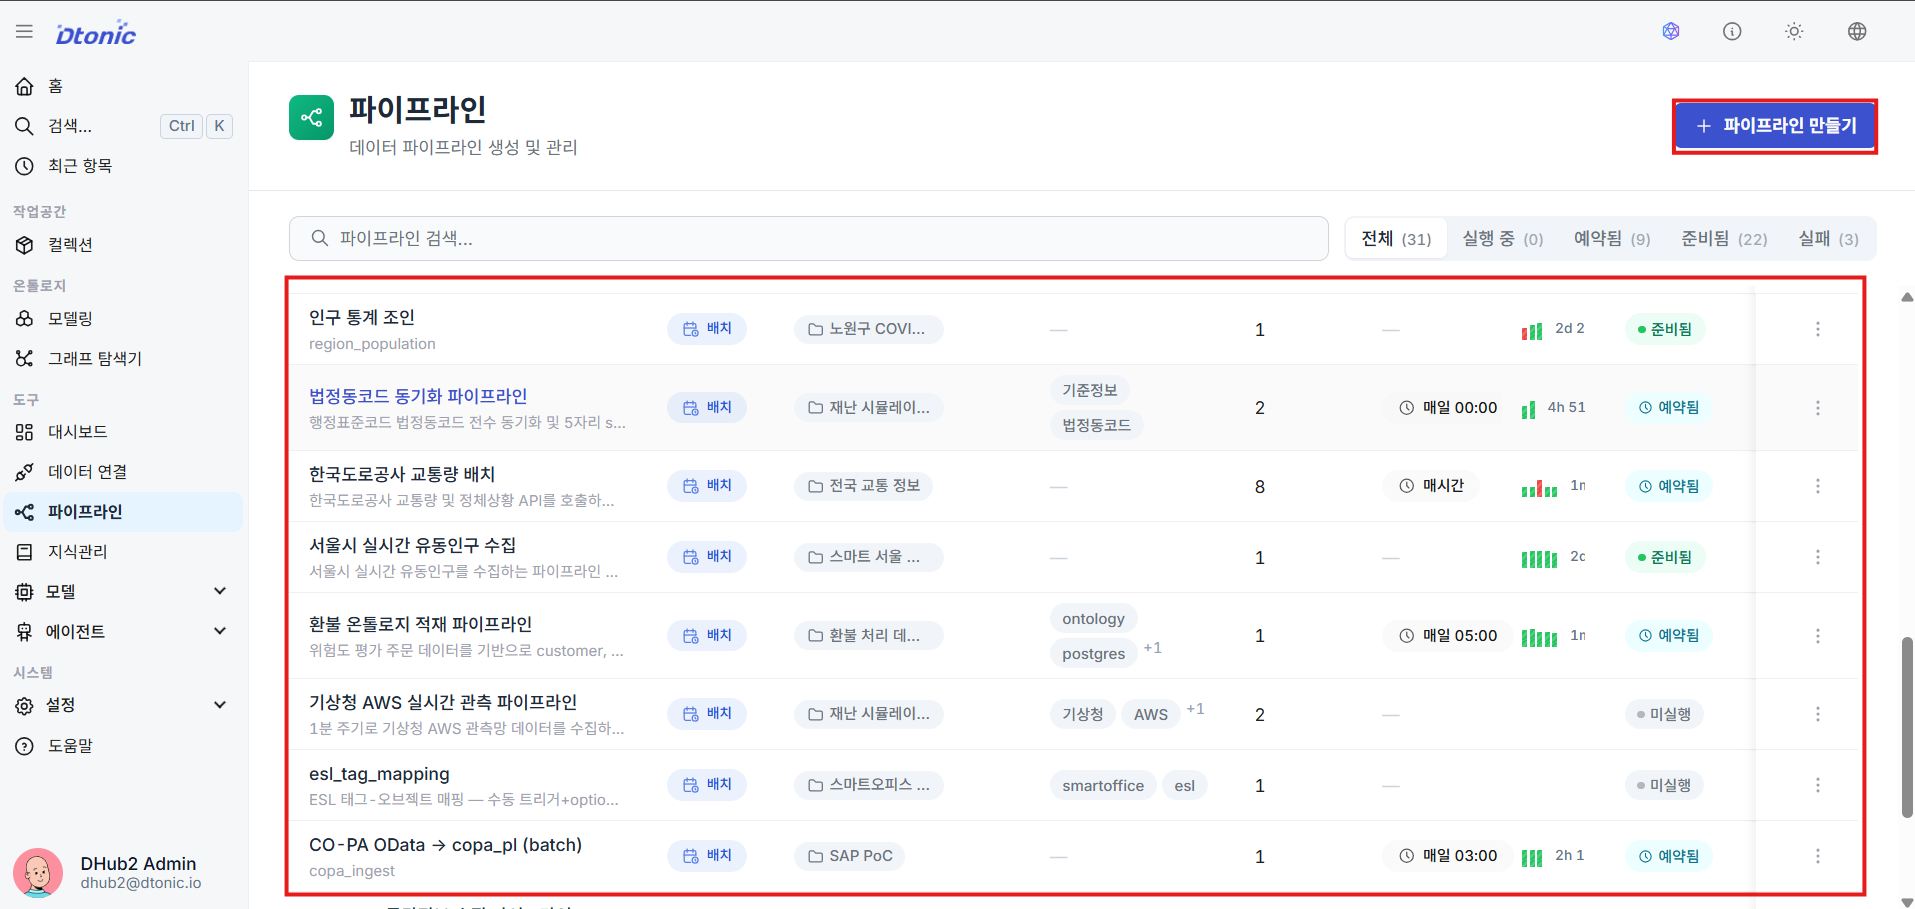
⑪ View the Pipeline List
Review the list of all registered pipelines and their last modified information from the Collection Explorer or the dedicated list page.
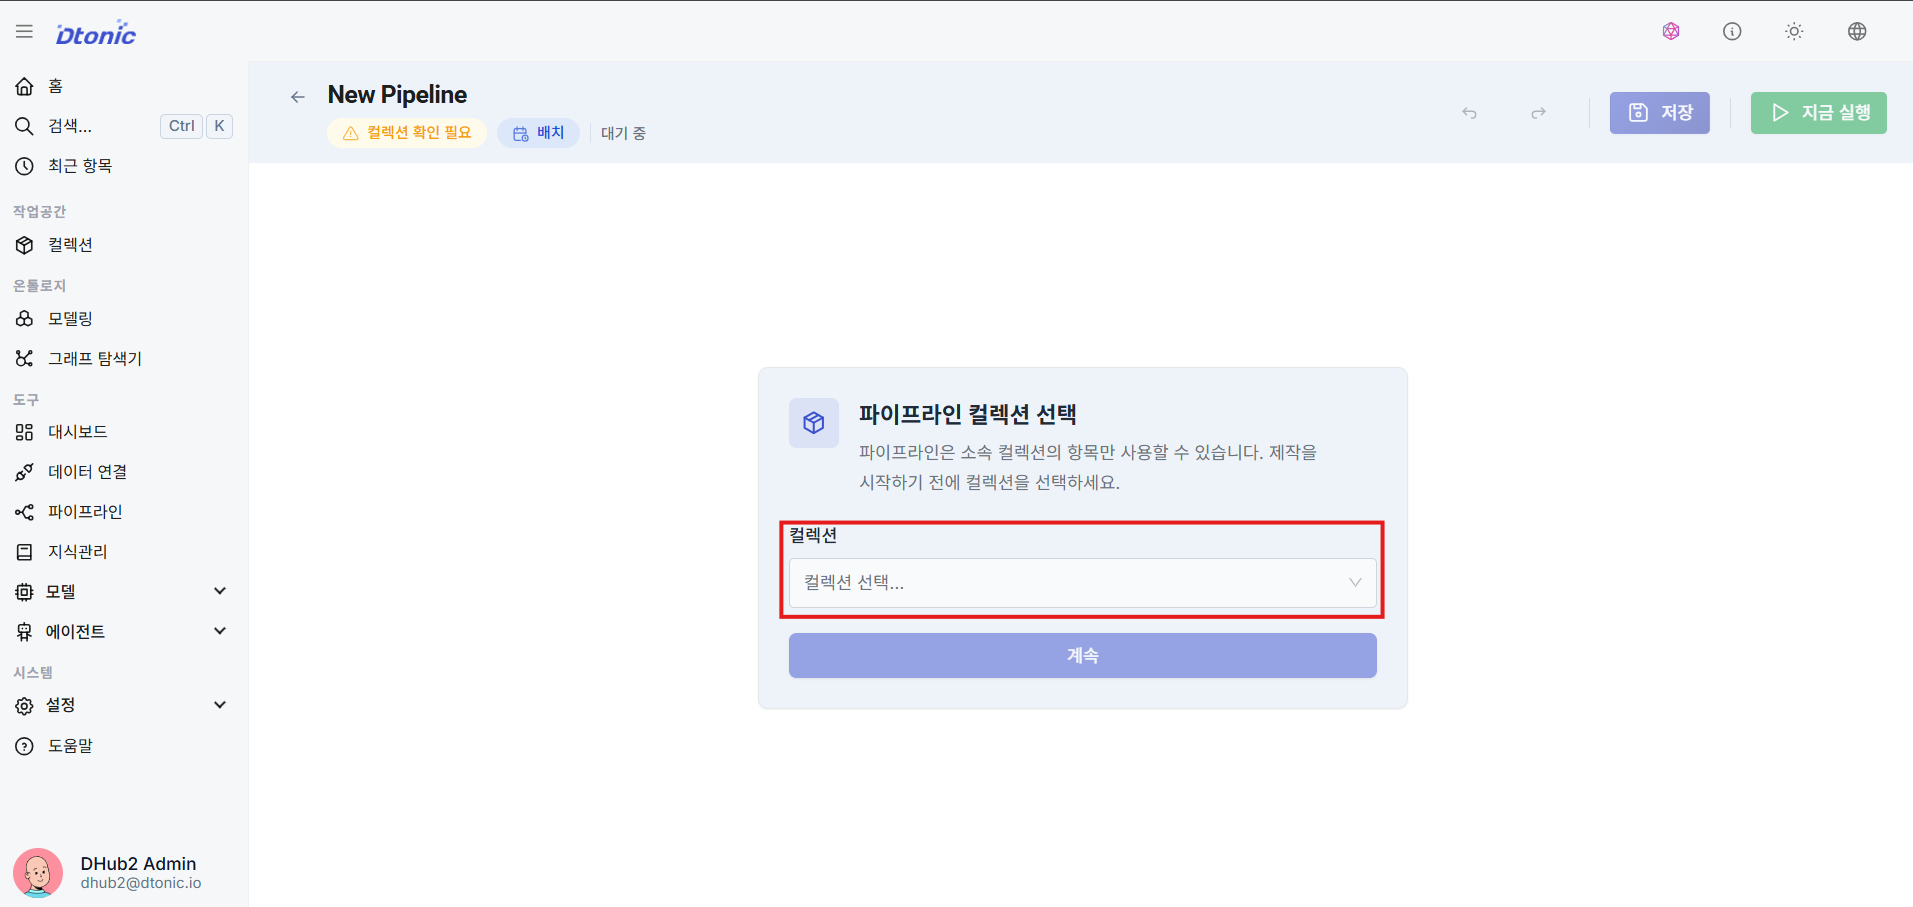
⑫ Create a Pipeline (Map to Collection)
When adding a new pipeline, you must explicitly map it to a target collection to define the scope and permissions for the work.
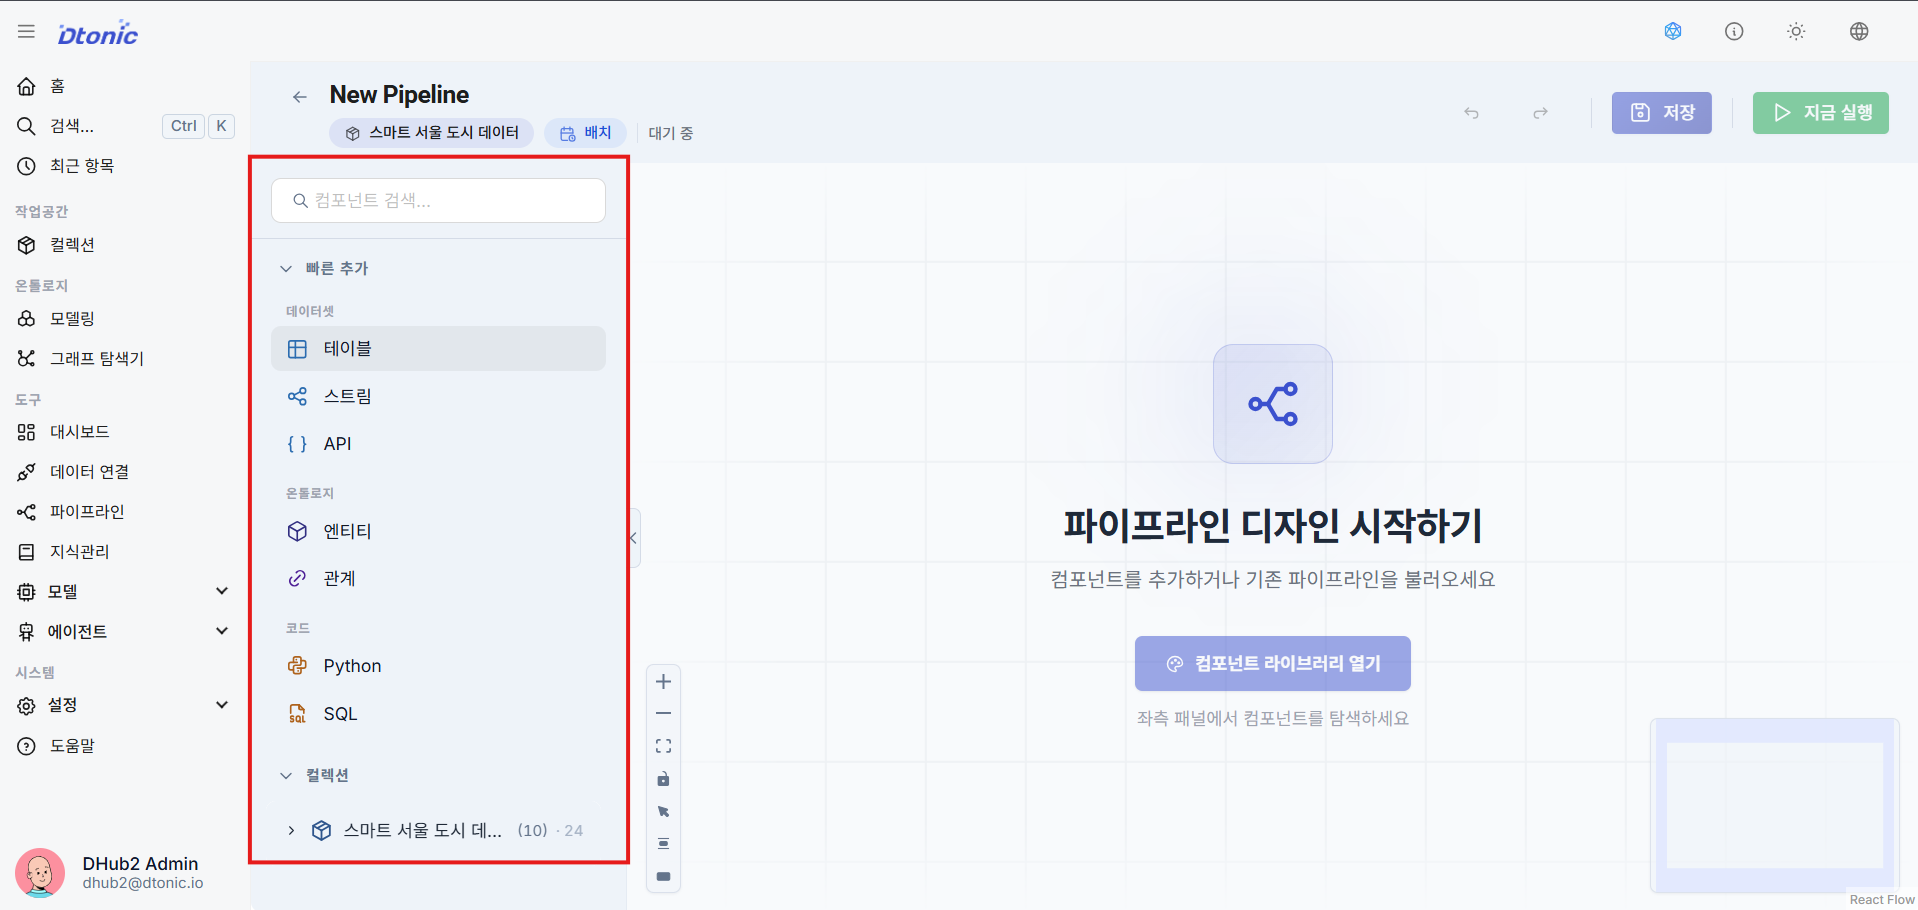
⑬ Pipeline Builder and Resource Reuse
The pipeline builder opens. Use the left sidebar to create new datasets and code on the fly, or search for and drag previously built datasets, code files, and entity resources directly onto the canvas to connect them.
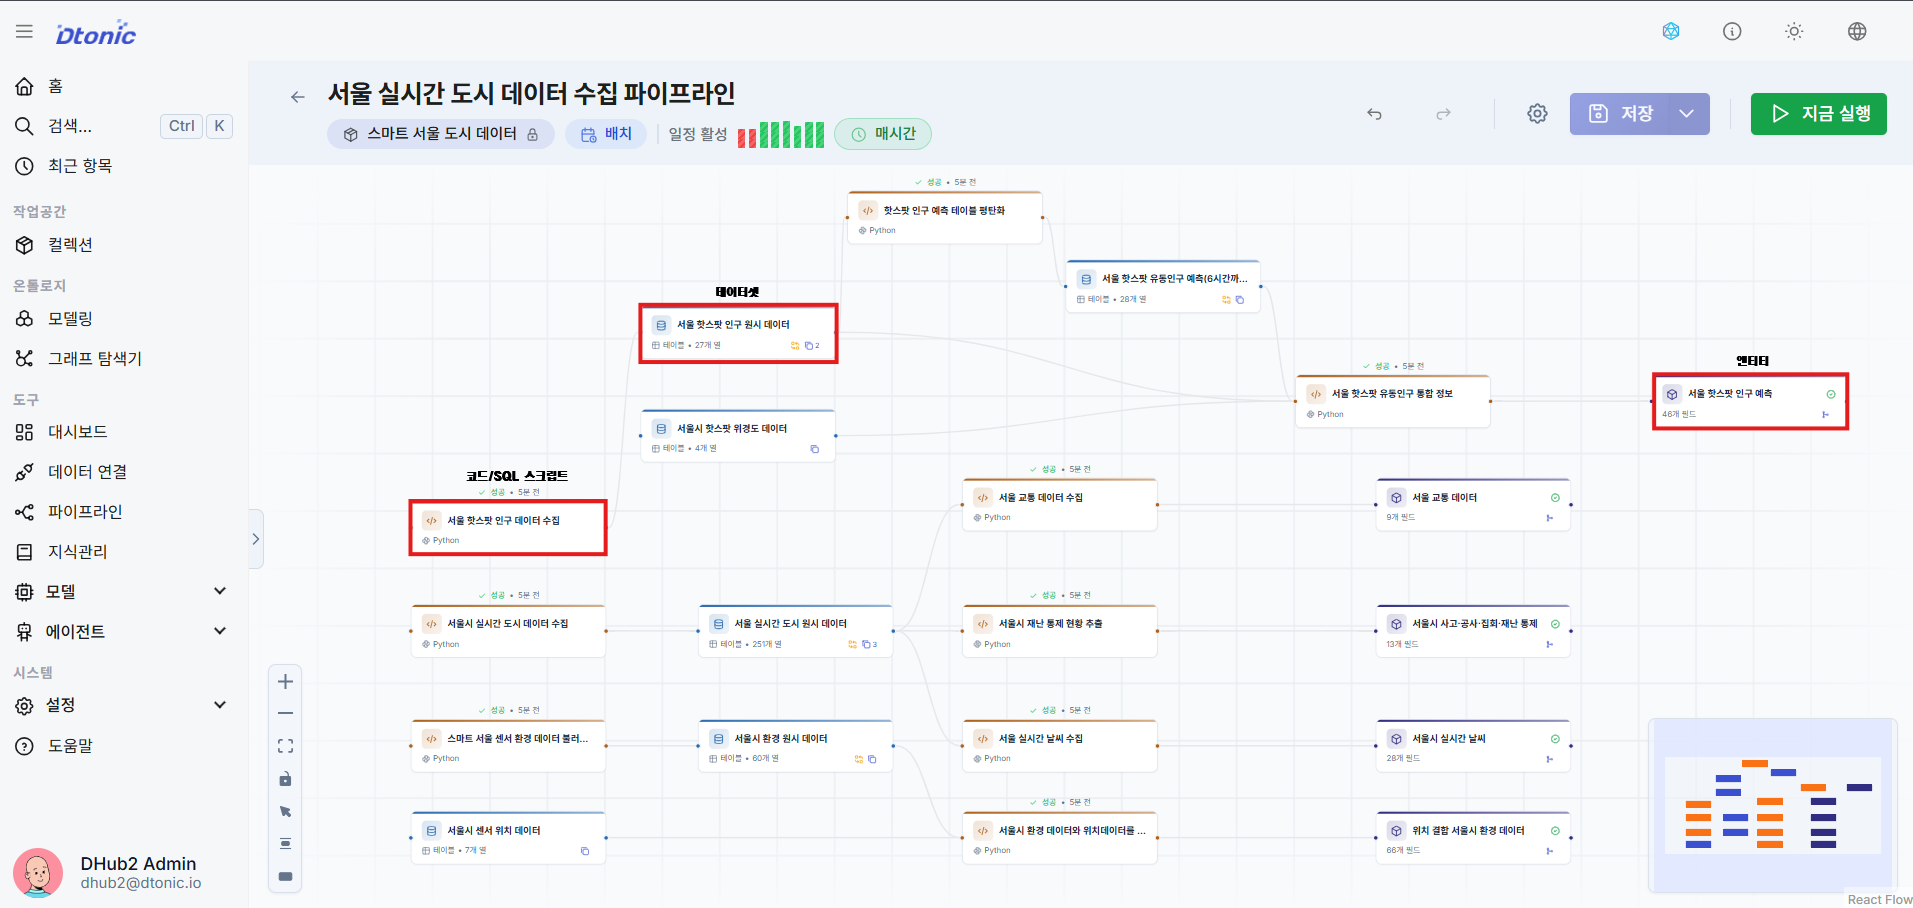
⑭ Completed Pipeline Flow
A view of an actual pipeline configuration where all nodes are organically arranged and connected in a proper flow.
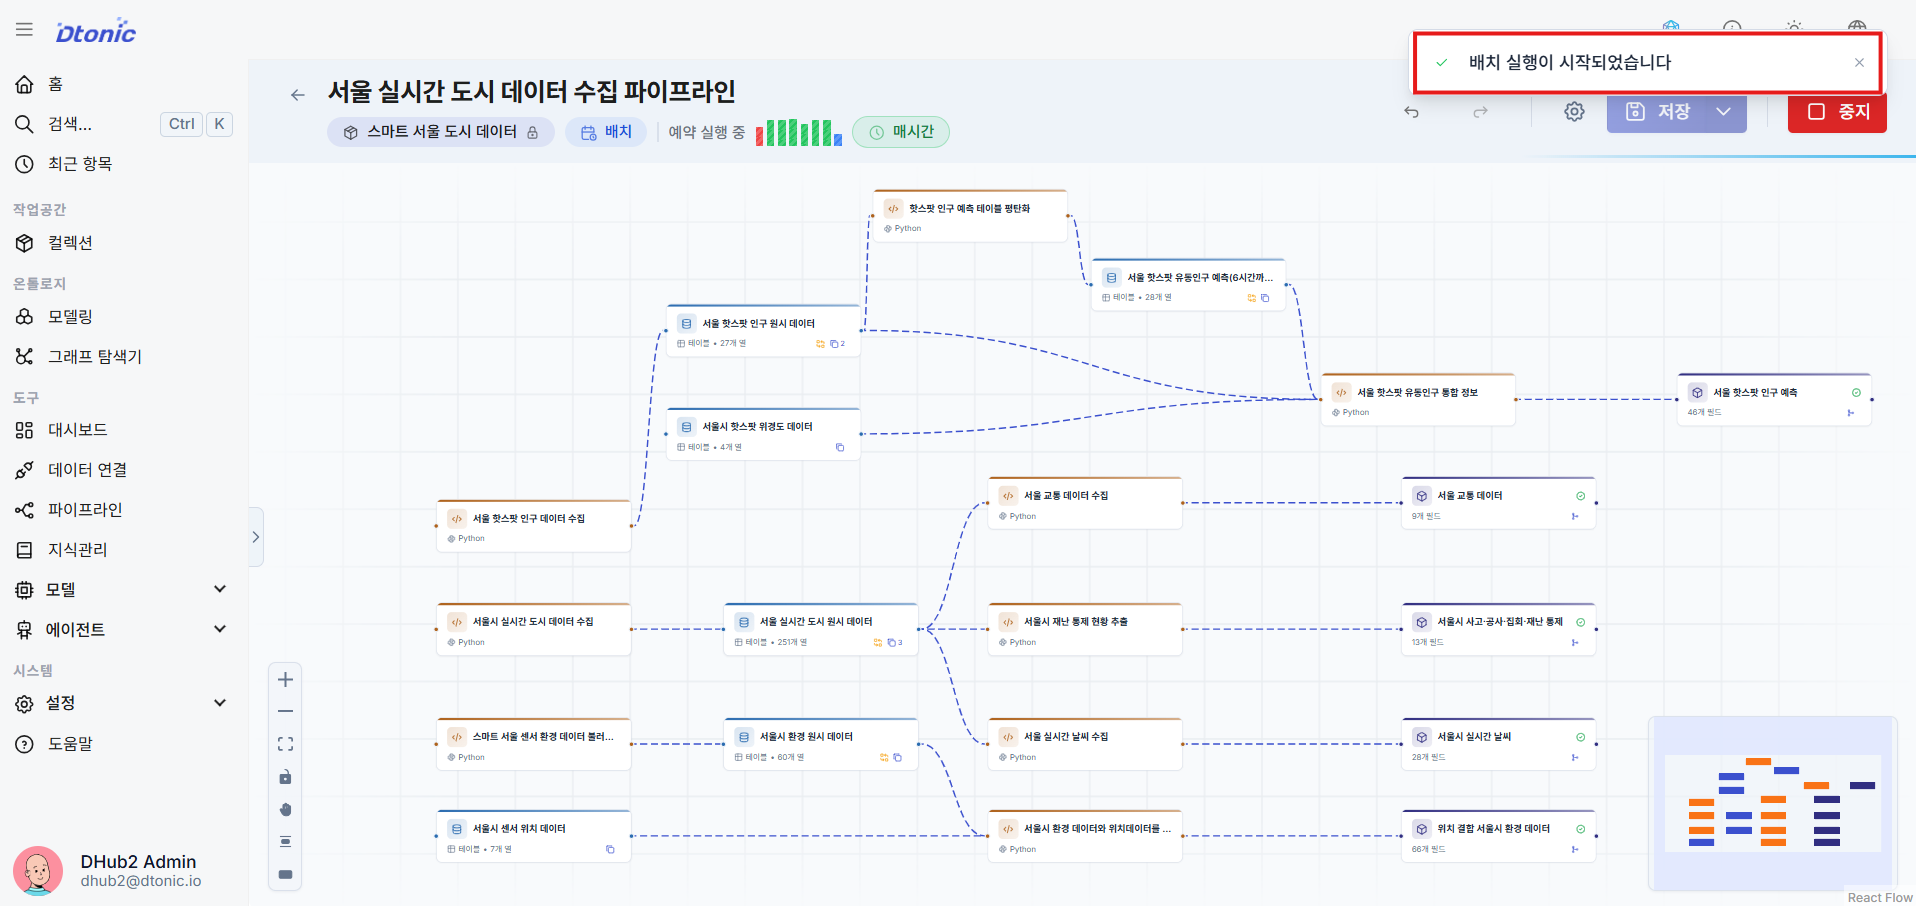
⑮ Run the Pipeline
Click the Run icon button in the top menu bar to trigger the ingestion job and start batch processing and transformation operations.
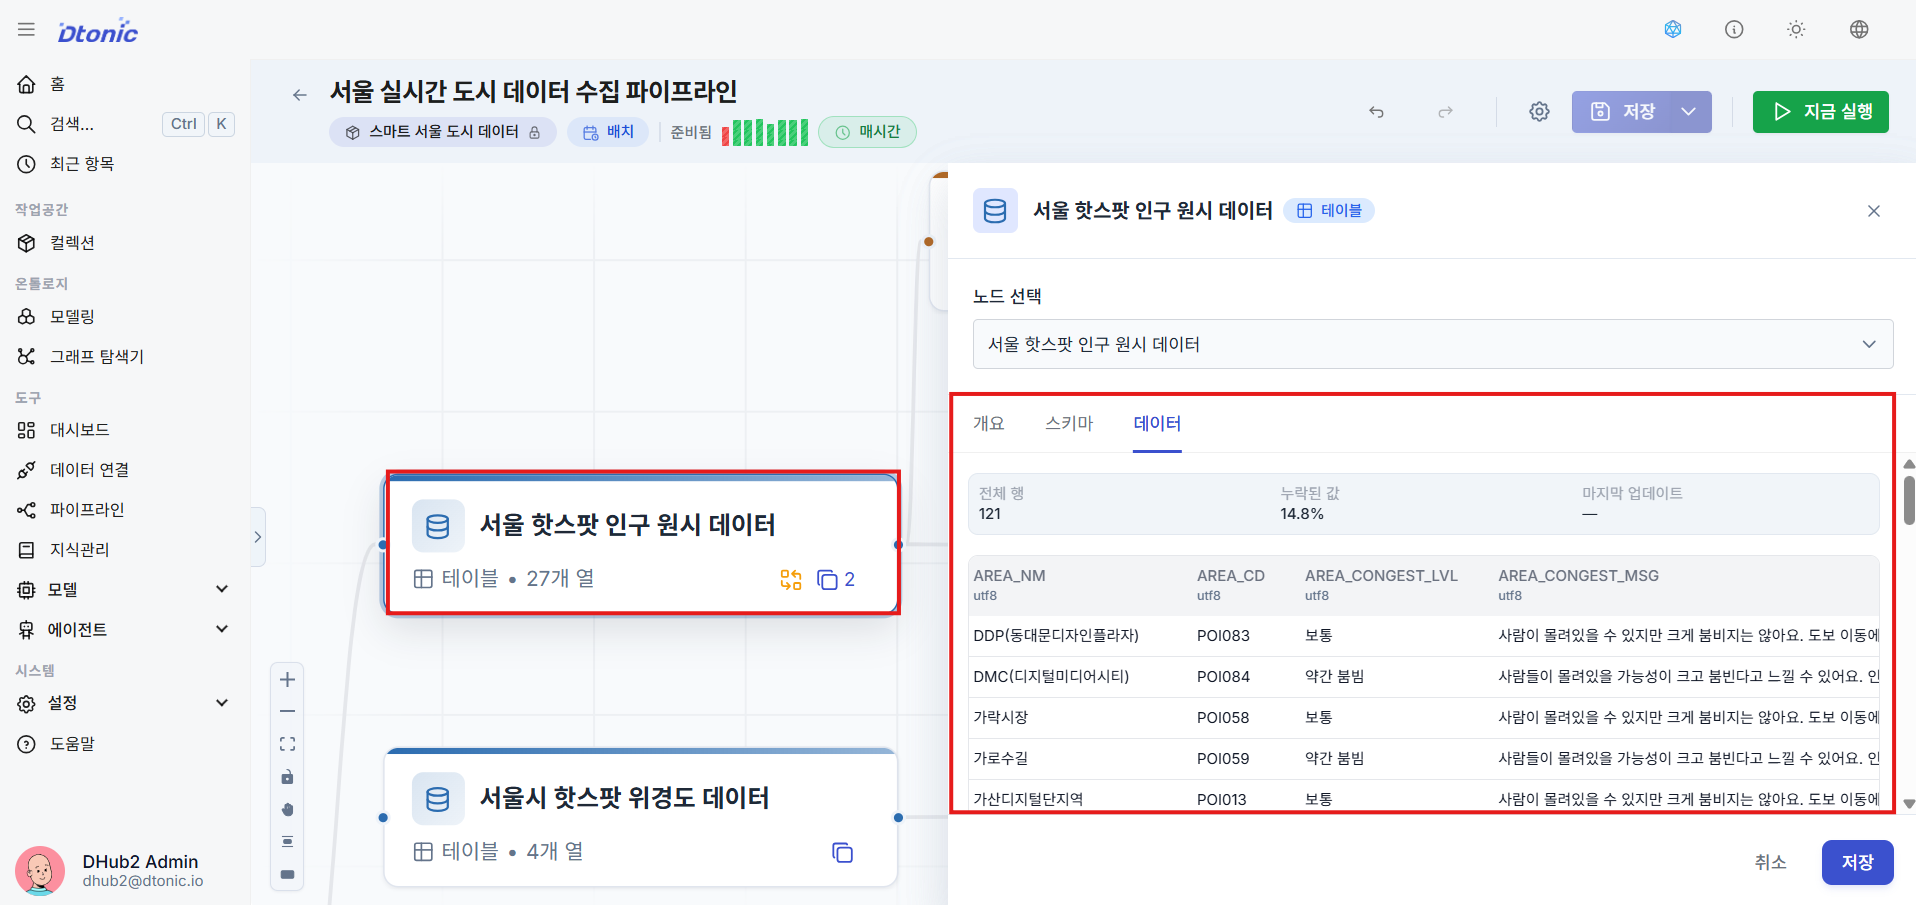
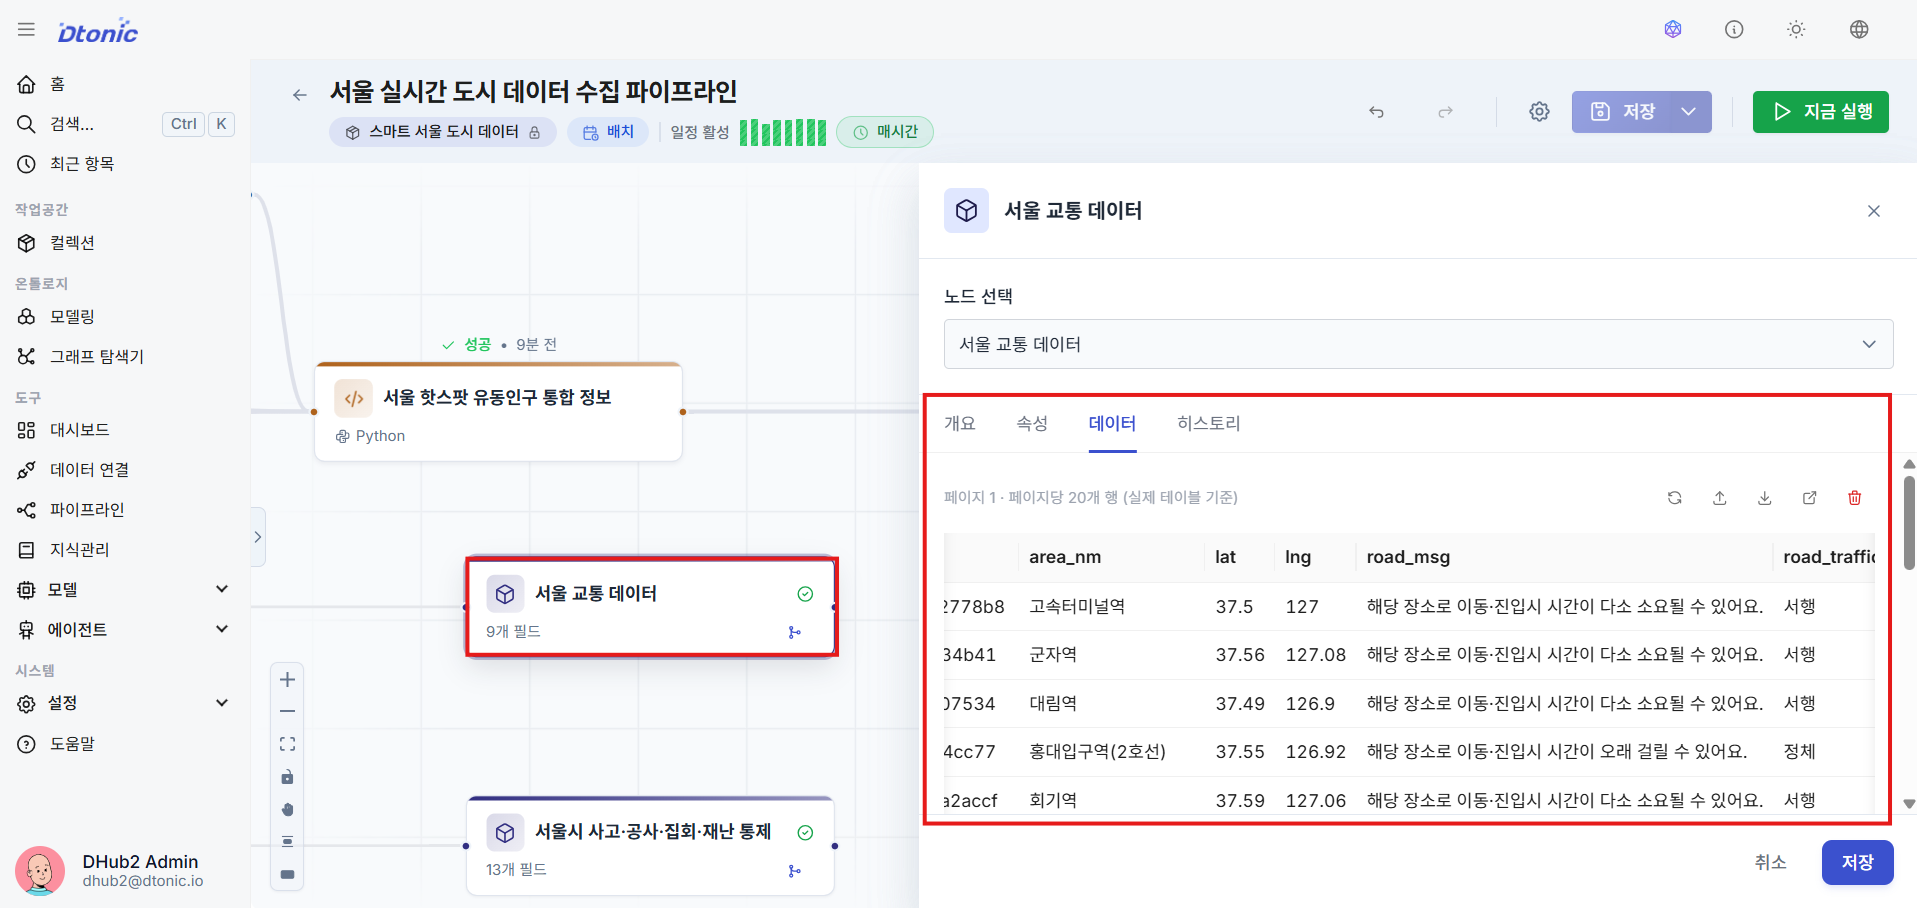
⑯ Verify Dataset Ingestion Results
After a successful run, navigate to the Dataset view within the target collection to confirm that the data has been correctly loaded into the Delta Lake format table structure.
⑰ Verify Entity Ingestion Results
Similarly, double-click on an Entity item in the ontology to confirm that graph instance data has been written successfully. D.Hub2 entities operate based on a PostgreSQL table for real-time transactions, and are mirrored to a Backing Dataset on ClickHouse for fast view queries.
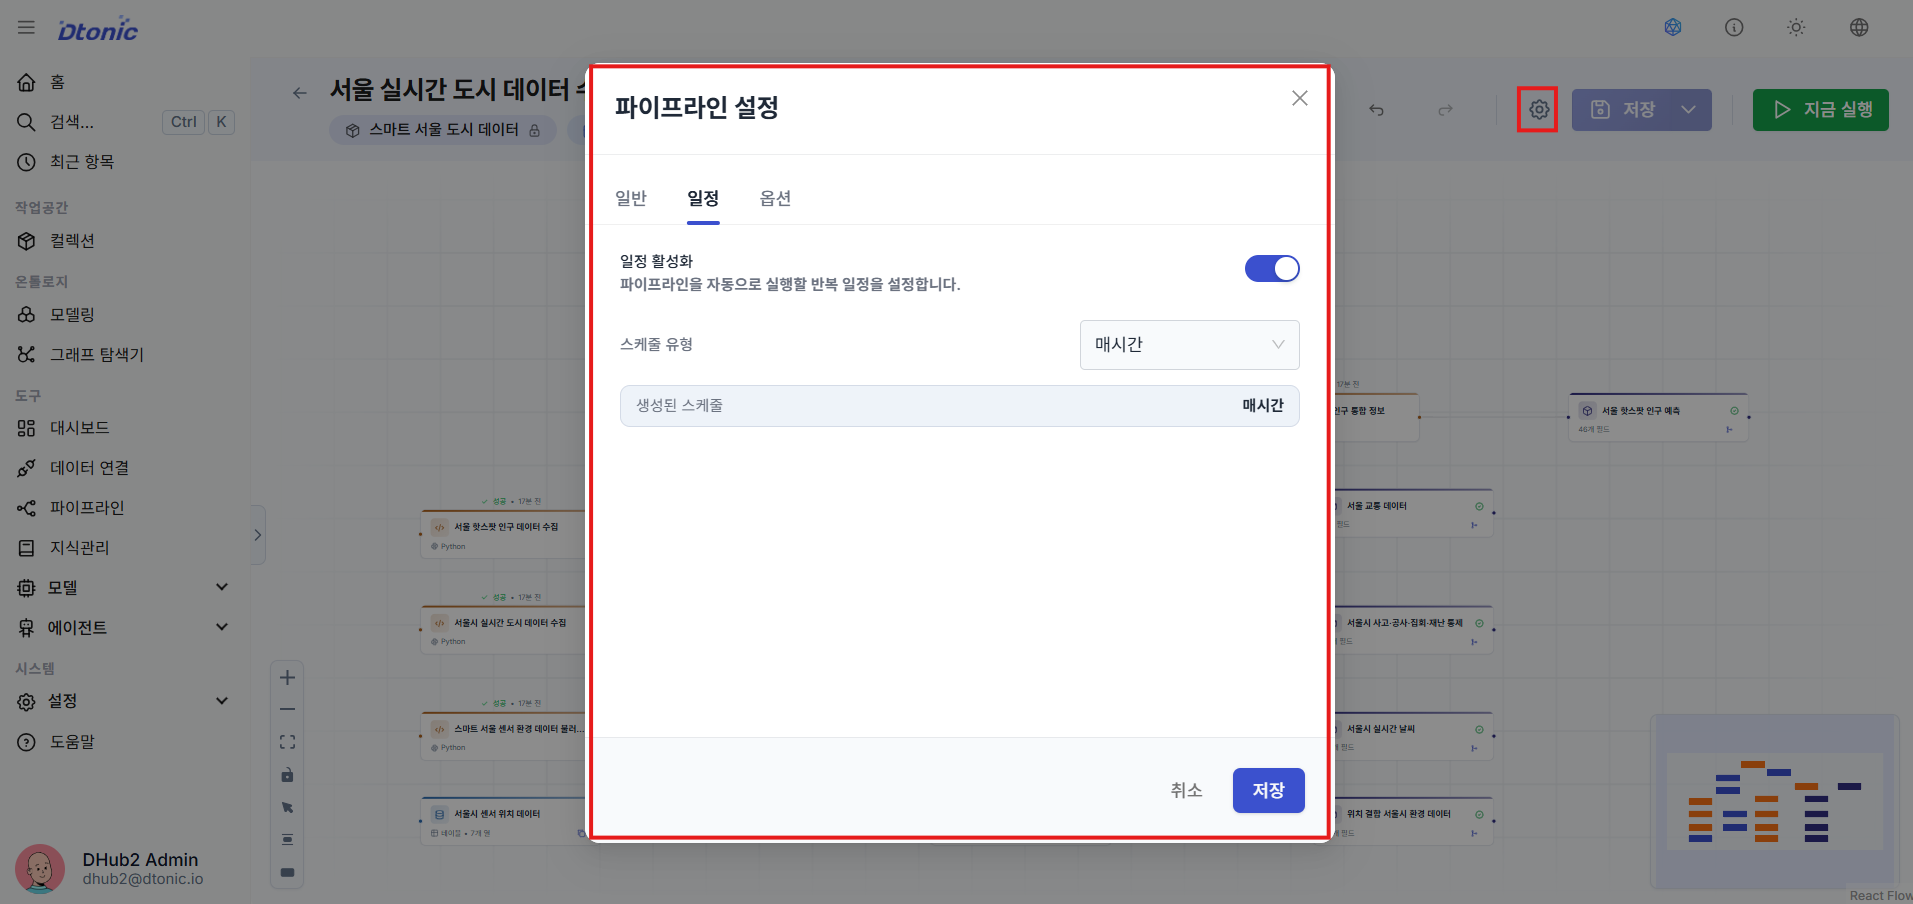
⑱ Configure the Pipeline Batch Scheduler
In the Batch Settings tab of the pipeline detail configuration, specify a cron schedule or recurrence rule (RRule) to schedule recurring data cleansing and automatic ingestion.
4. Dashboard Visualization details
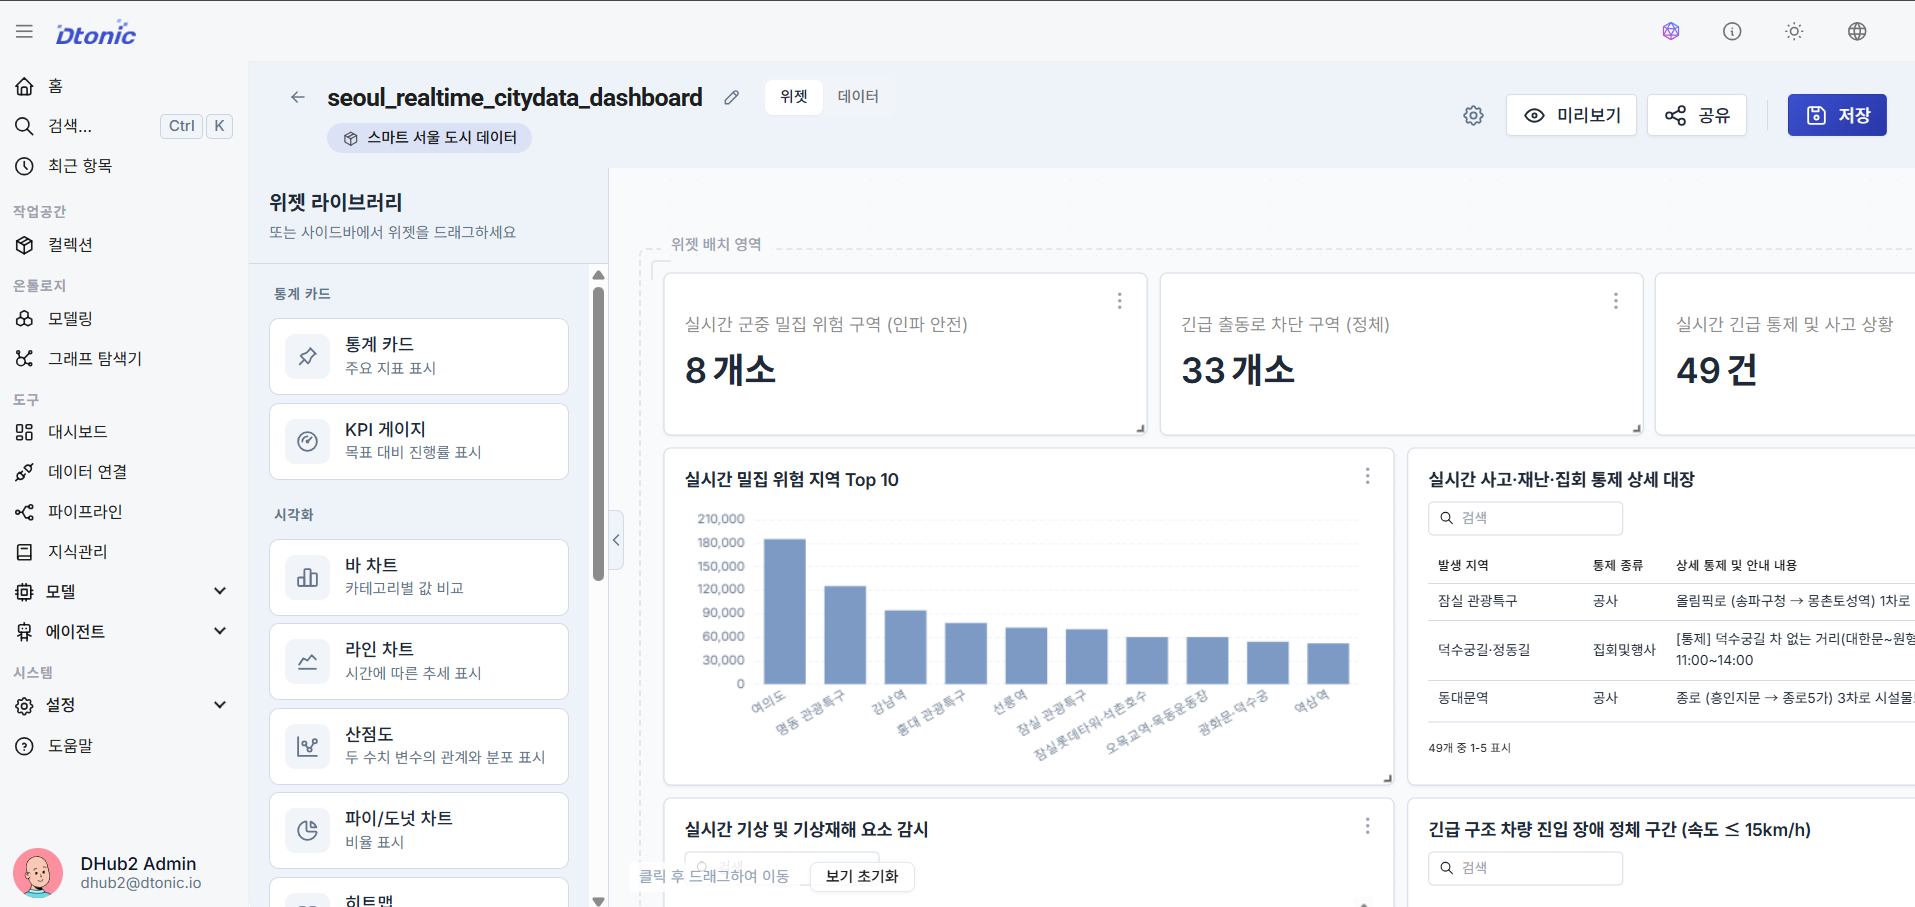
⑲ Dashboard Rendering
Using the Delta Lake datasets and PostgreSQL ontology entity data loaded correctly via the pipeline, you can build dashboards for real-time monitoring and analysis.
Map data sources and aggregate data in the widget editor, then arrange Map widgets, Scatter charts, Bar/Line charts, Tables, Statistic cards, Gauge charts, Pie charts, Heatmaps, Date Range Selectors, custom Text boxes, and external site Embed (iFrame) widgets on a grid layout to complete your visualization dashboard for decision-making.
5. LLM Model Management details
Centrally manage LLM API information and serving specifications to be injected into agents as a shared catalog.
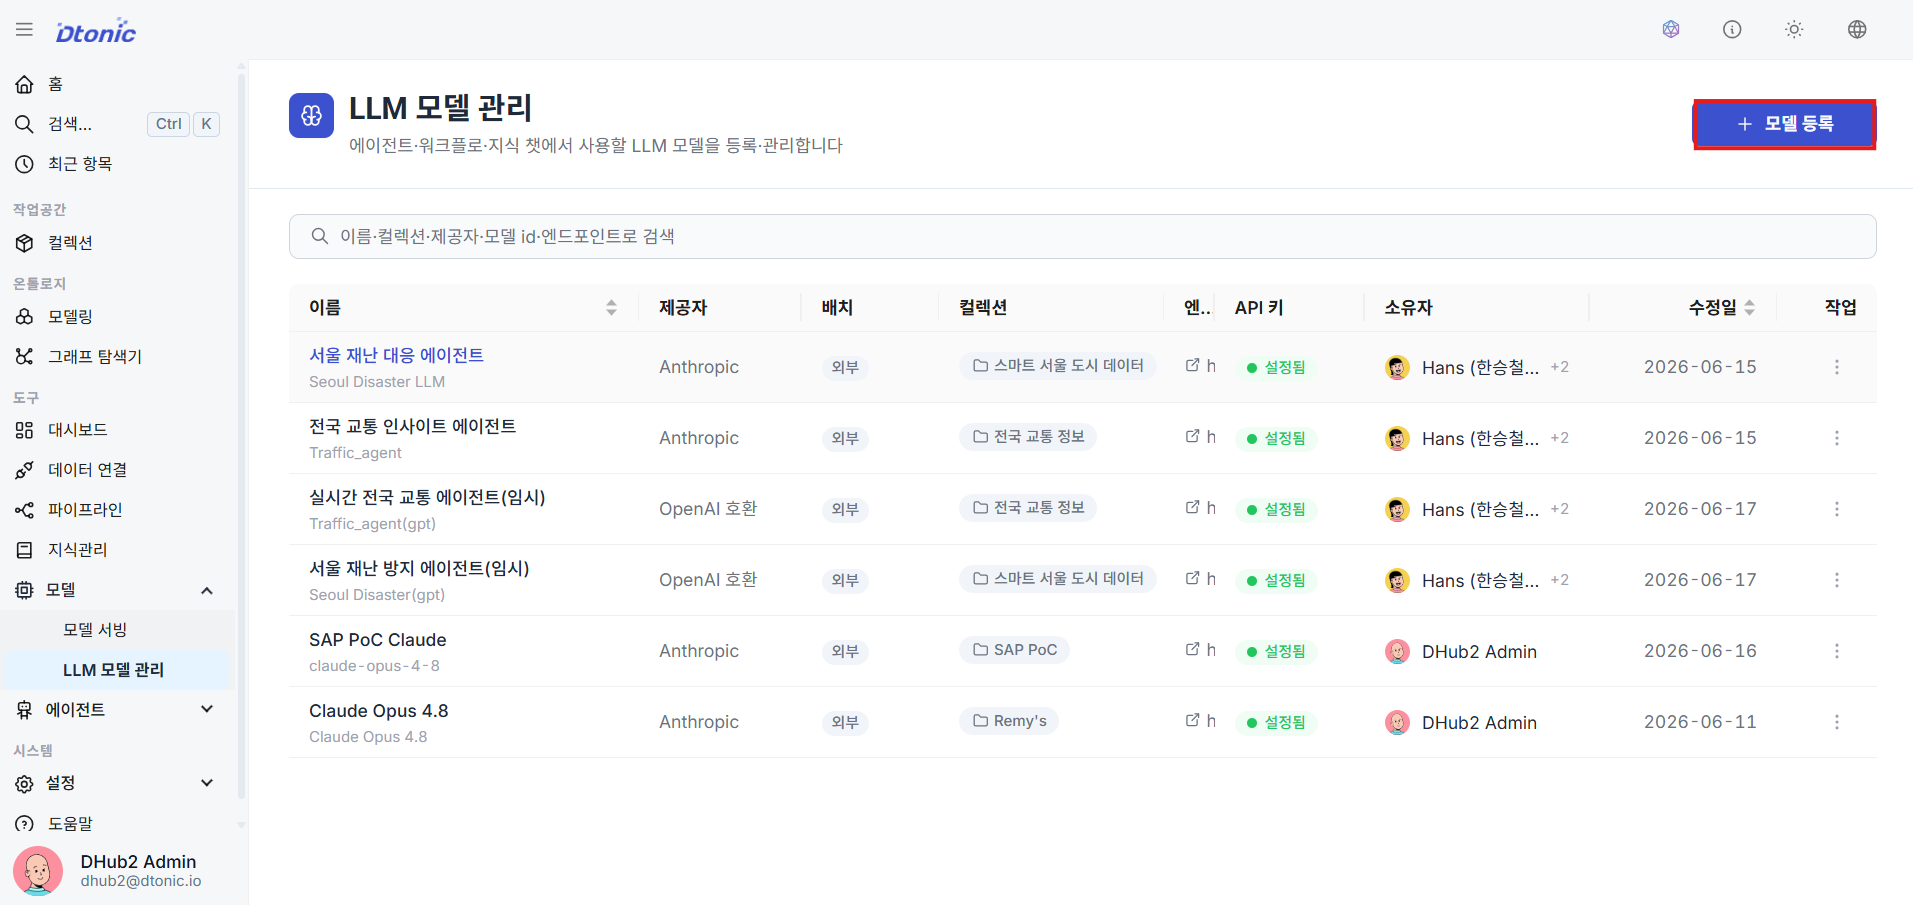
⑳ Model Management List and Registration
Go to Applications → Models → LLM Models in the sidebar to see the list of currently available models, then click the Register Model button in the upper right.
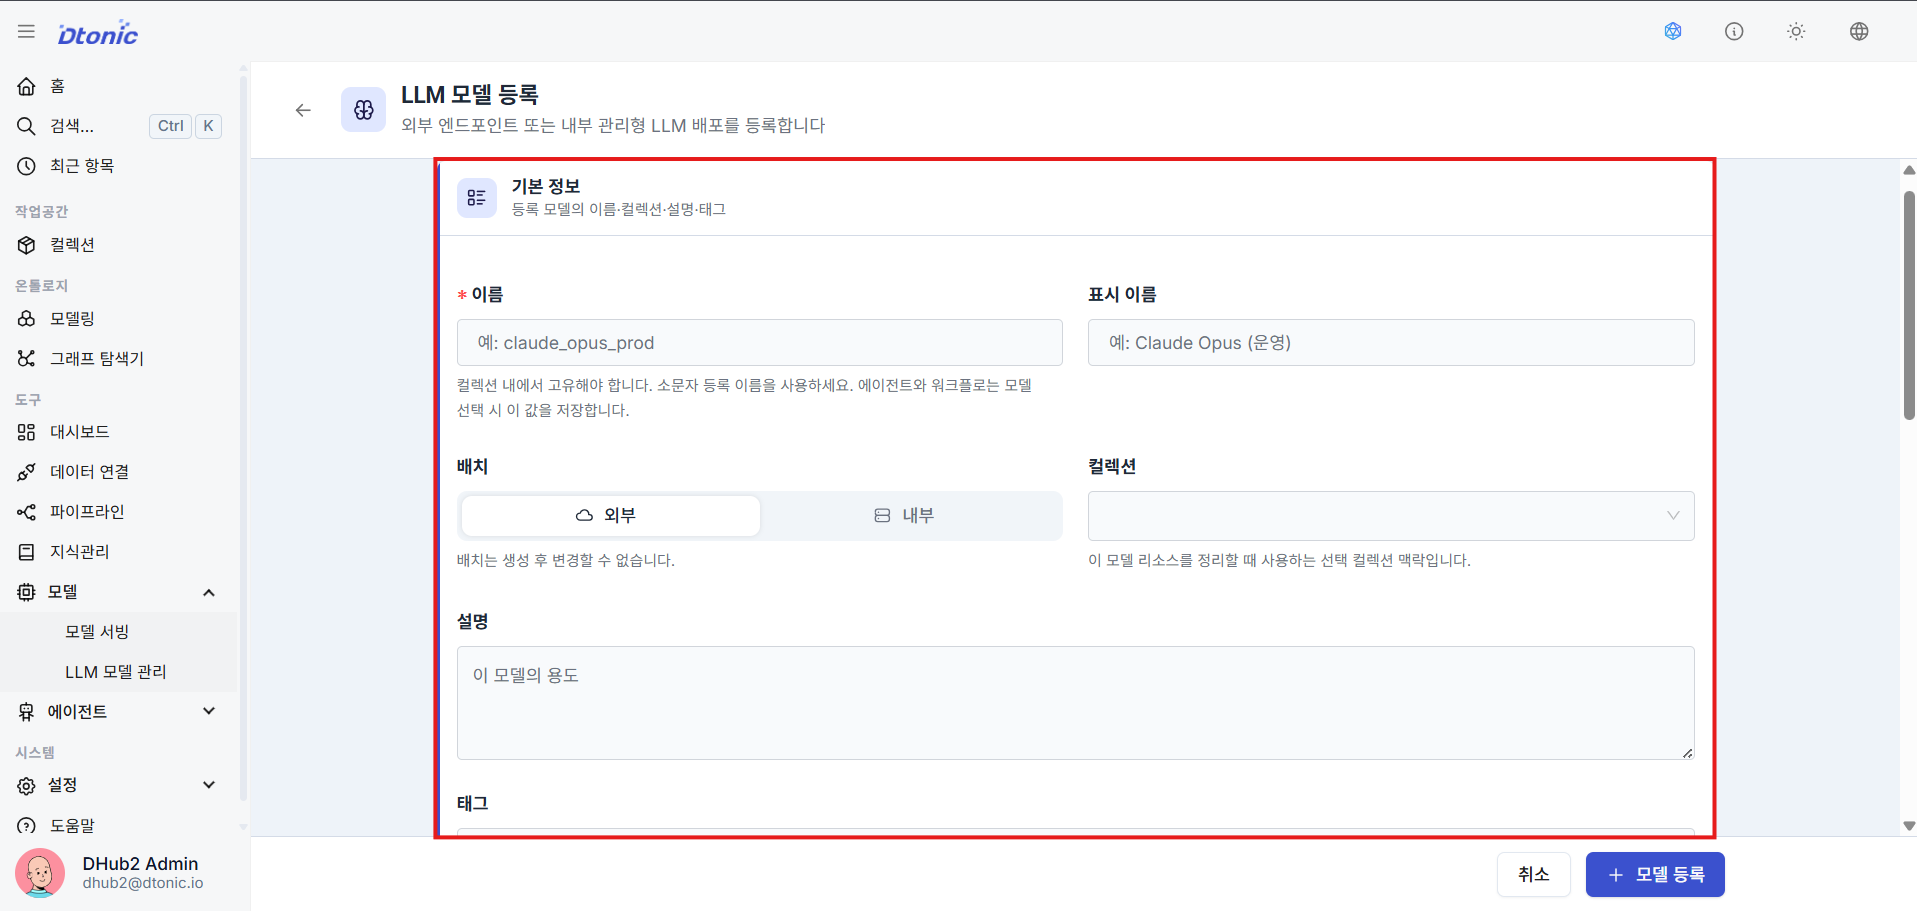
㉑ Enter Basic Model Information (Decide Deployment Type)
Enter the name, display alias, the collection to map to, and a description.
- External: Select this when registering an already-running external or self-hosted LLM endpoint by its Base URL.
- Internal: Select this when D.Hub2 deploys and manages the model runtime directly on Kubernetes. In this case, also register the deployment settings including image, port, resources, and environment variables.
- Note: The deployment type cannot be changed after registration.
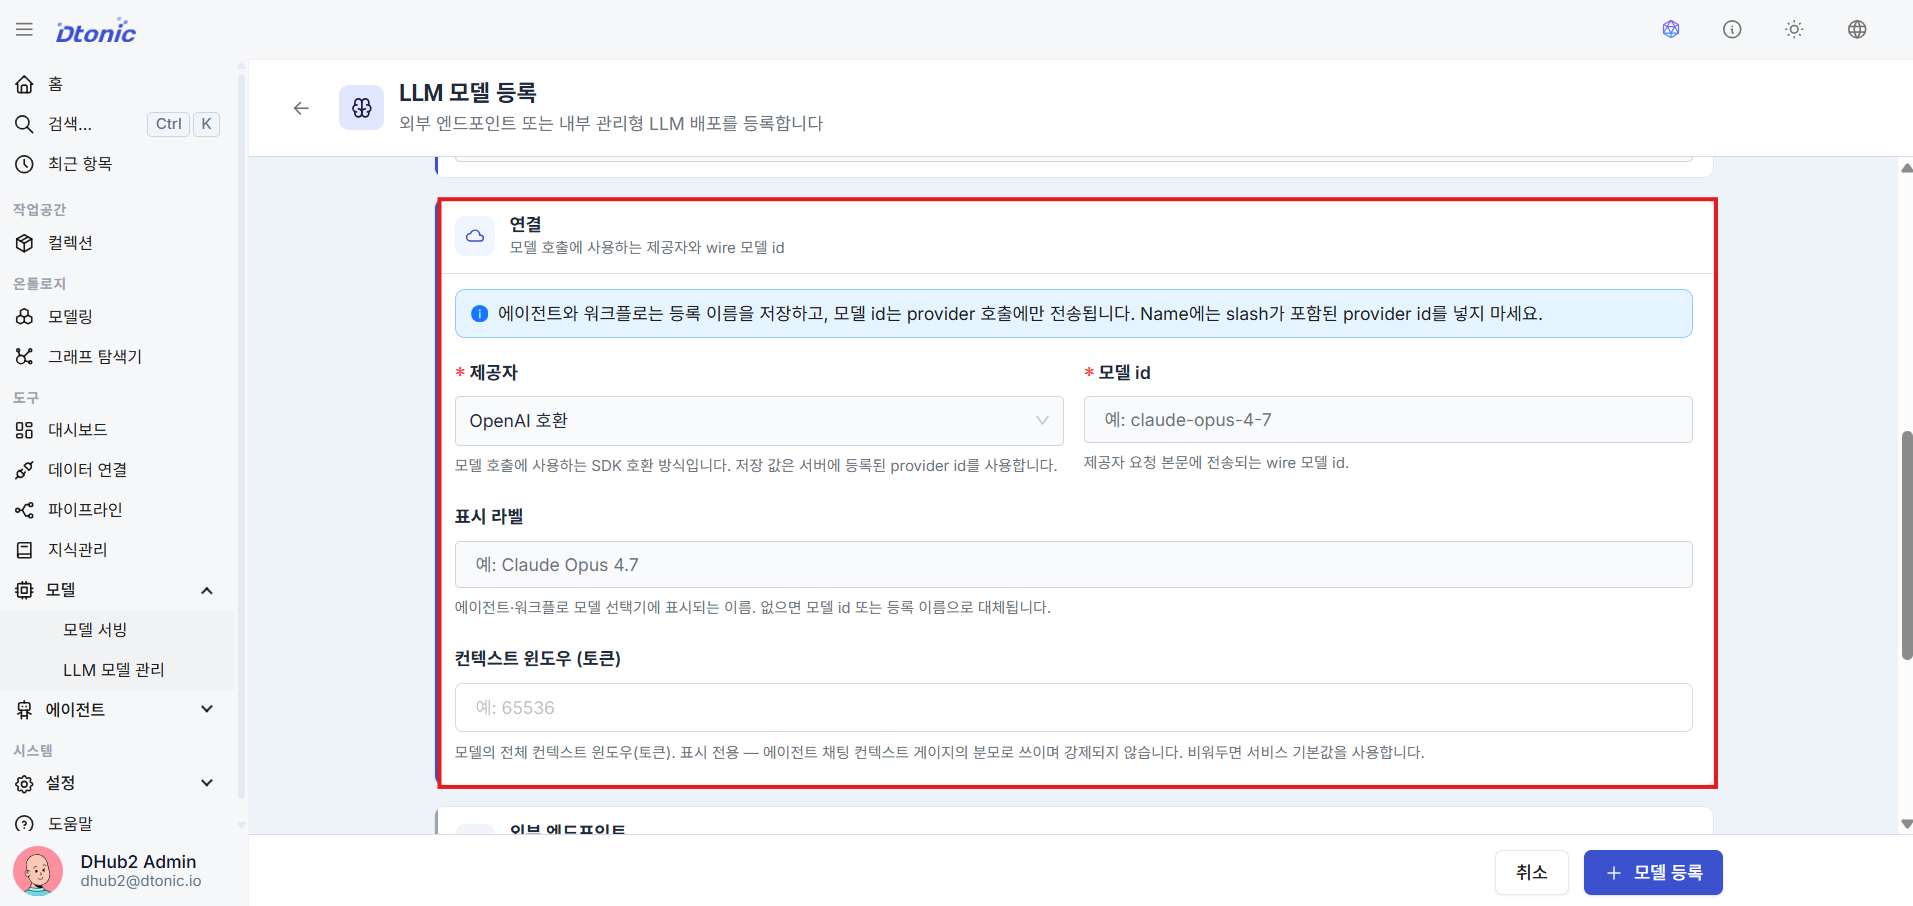
㉒ Set Provider and Model Identifier
Select the registered provider from the Provider list (e.g., OpenAI-compatible, Claude-compatible), then enter the unique model name ID to be sent to the actual API (e.g., claude-opus-4-7, gpt-oss-120b).
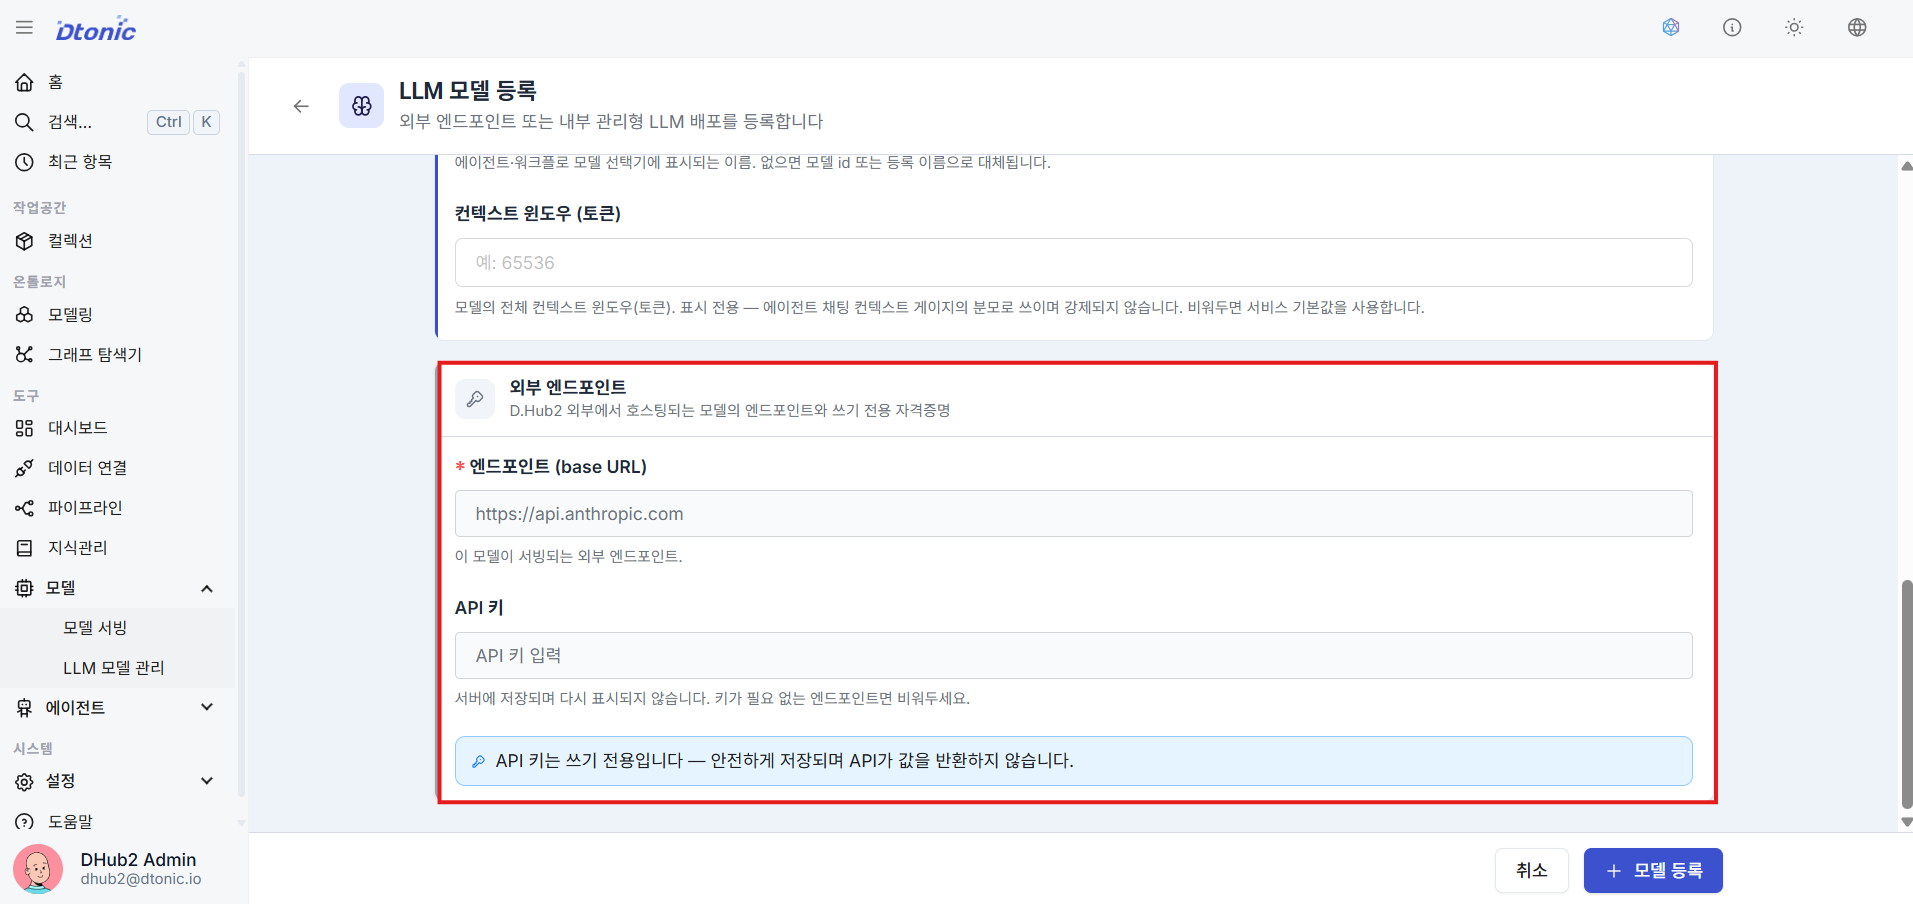
㉓ Bind Endpoint and API Key
For External models, specify the server endpoint (Base URL) to which the model API will be sent, and enter the API Key secret value (Access Token) to be included in the communication header, then save. For Internal models, you do not enter a Base URL directly — the platform constructs the internal service endpoint based on the registered deployment settings.
6. Building an AI Agent (AI Agent Builder) details
Assemble agents that perform reasoning actions by combining user prompt requirements with registered tools.
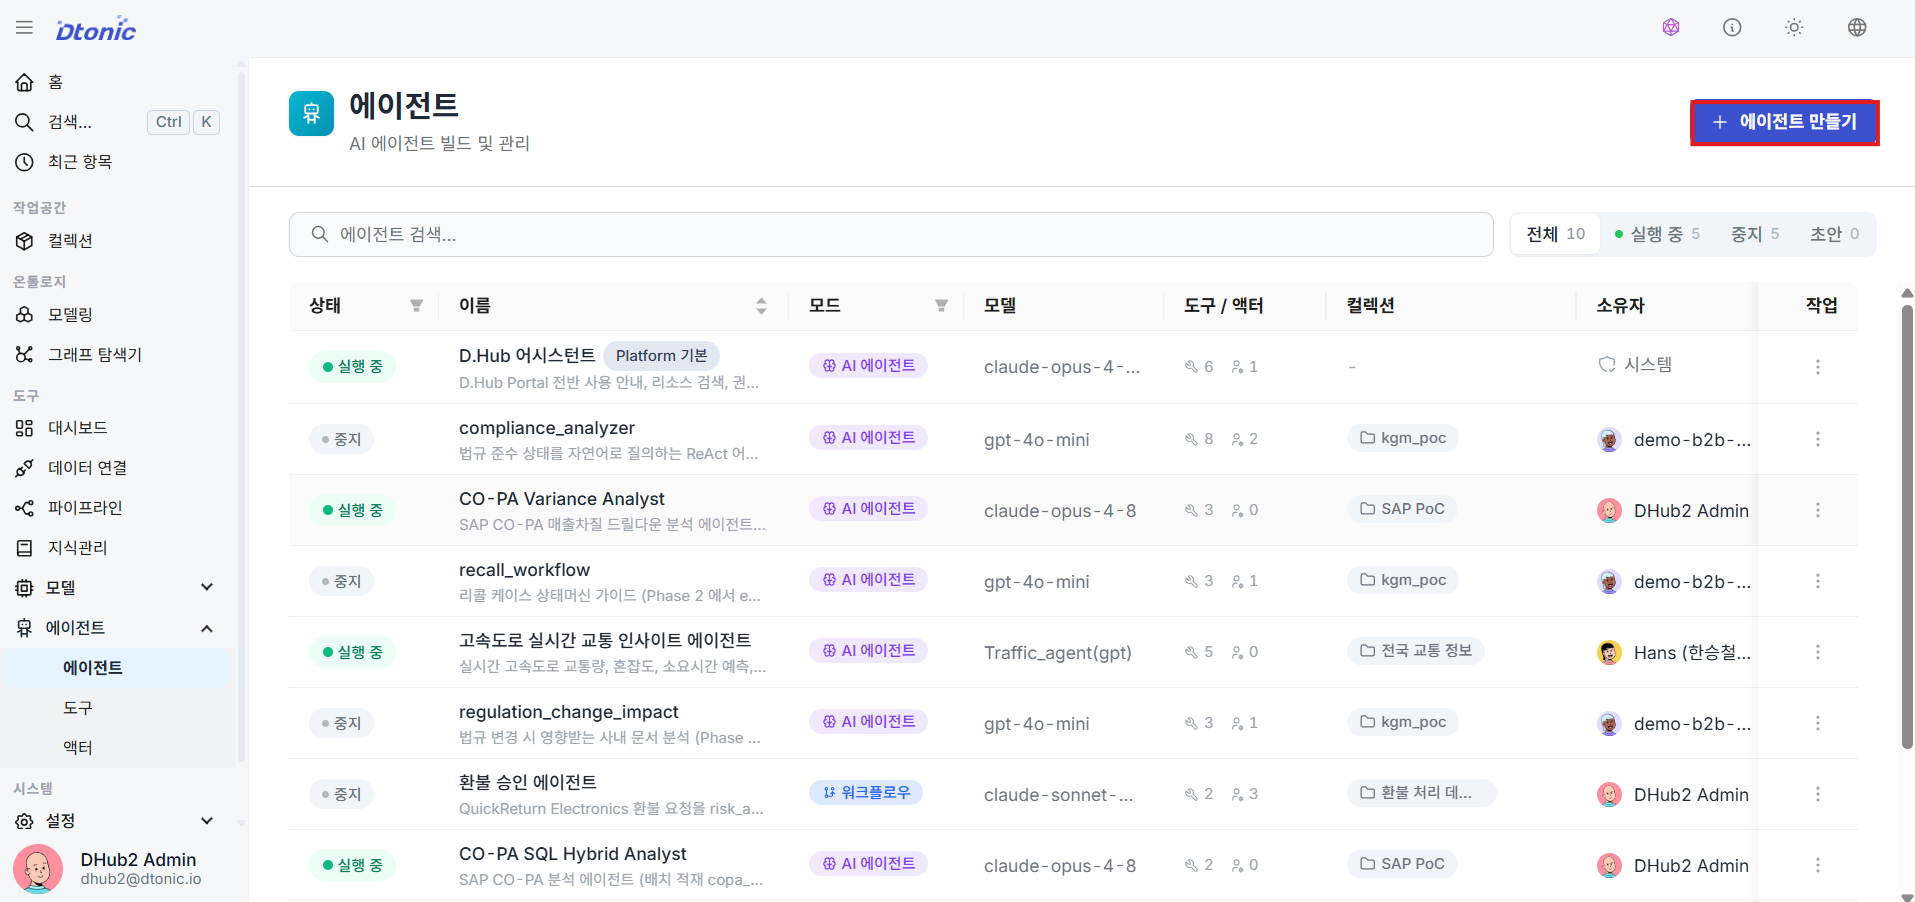
㉔ Agent Management Page
Go to the Agents menu in the sidebar to monitor existing deployed or in-progress agents, then proceed with + Create Agent.
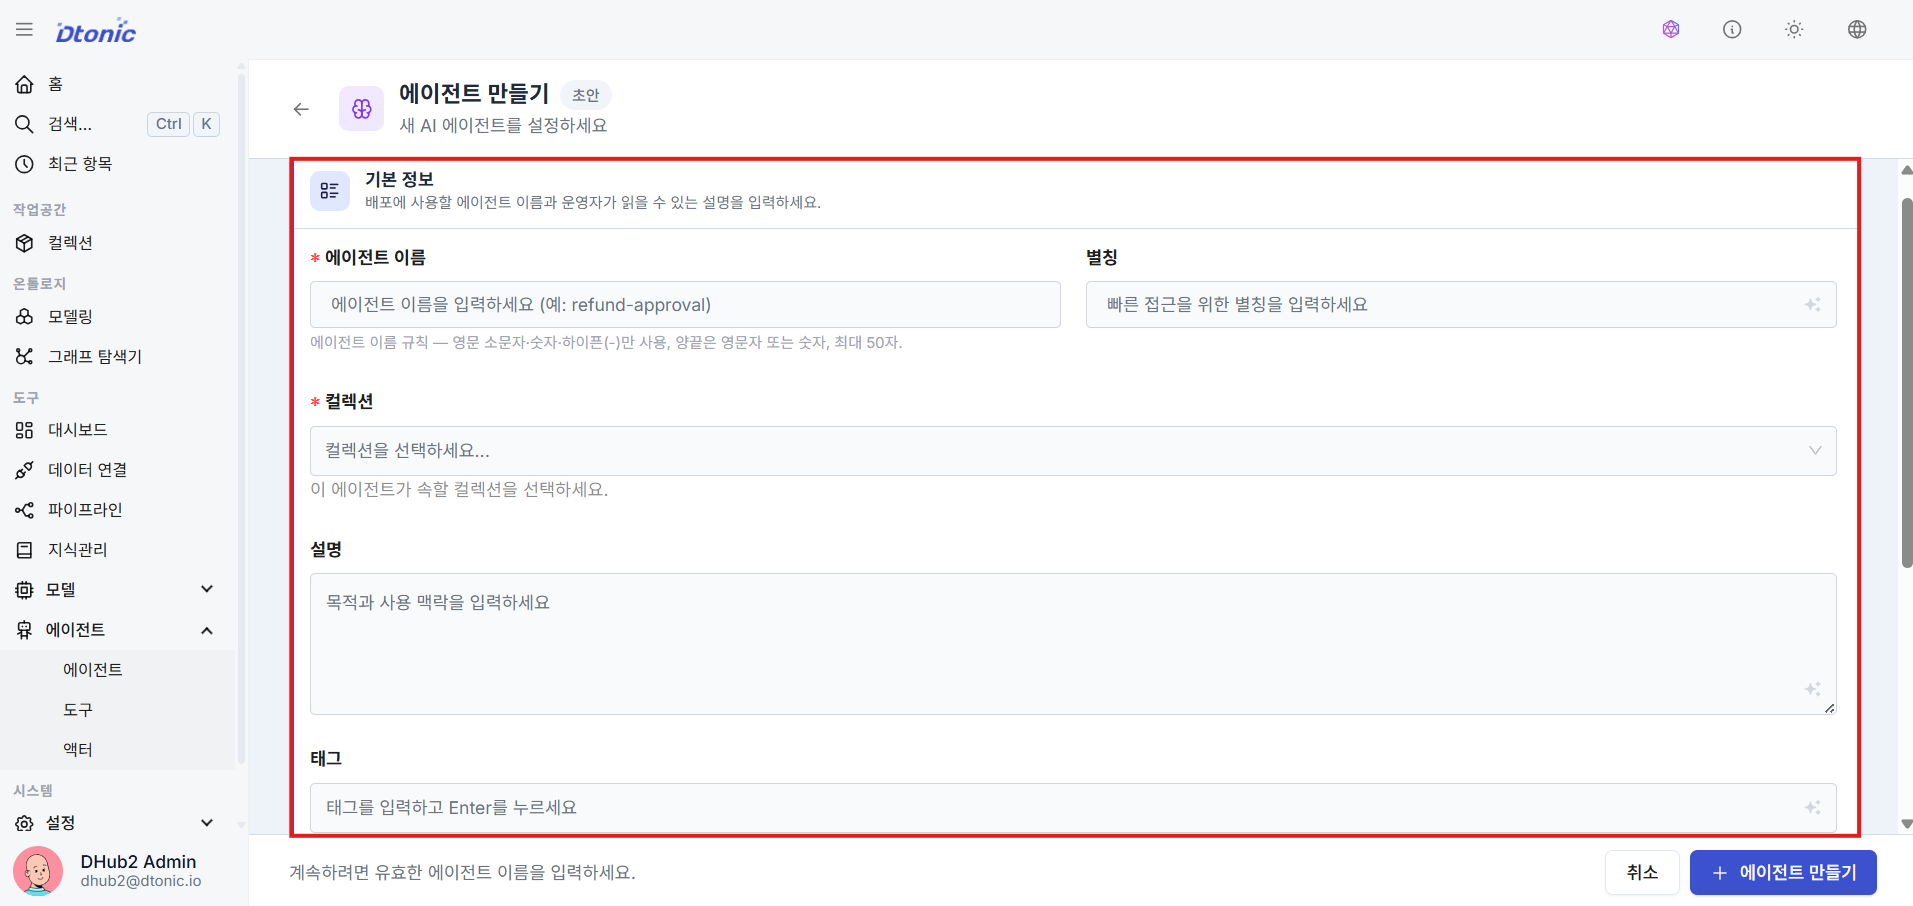
㉕ Enter Basic Agent Information
Enter the agent's name, display alias, and map the Collection ID the agent belongs to. (Collection selection required)
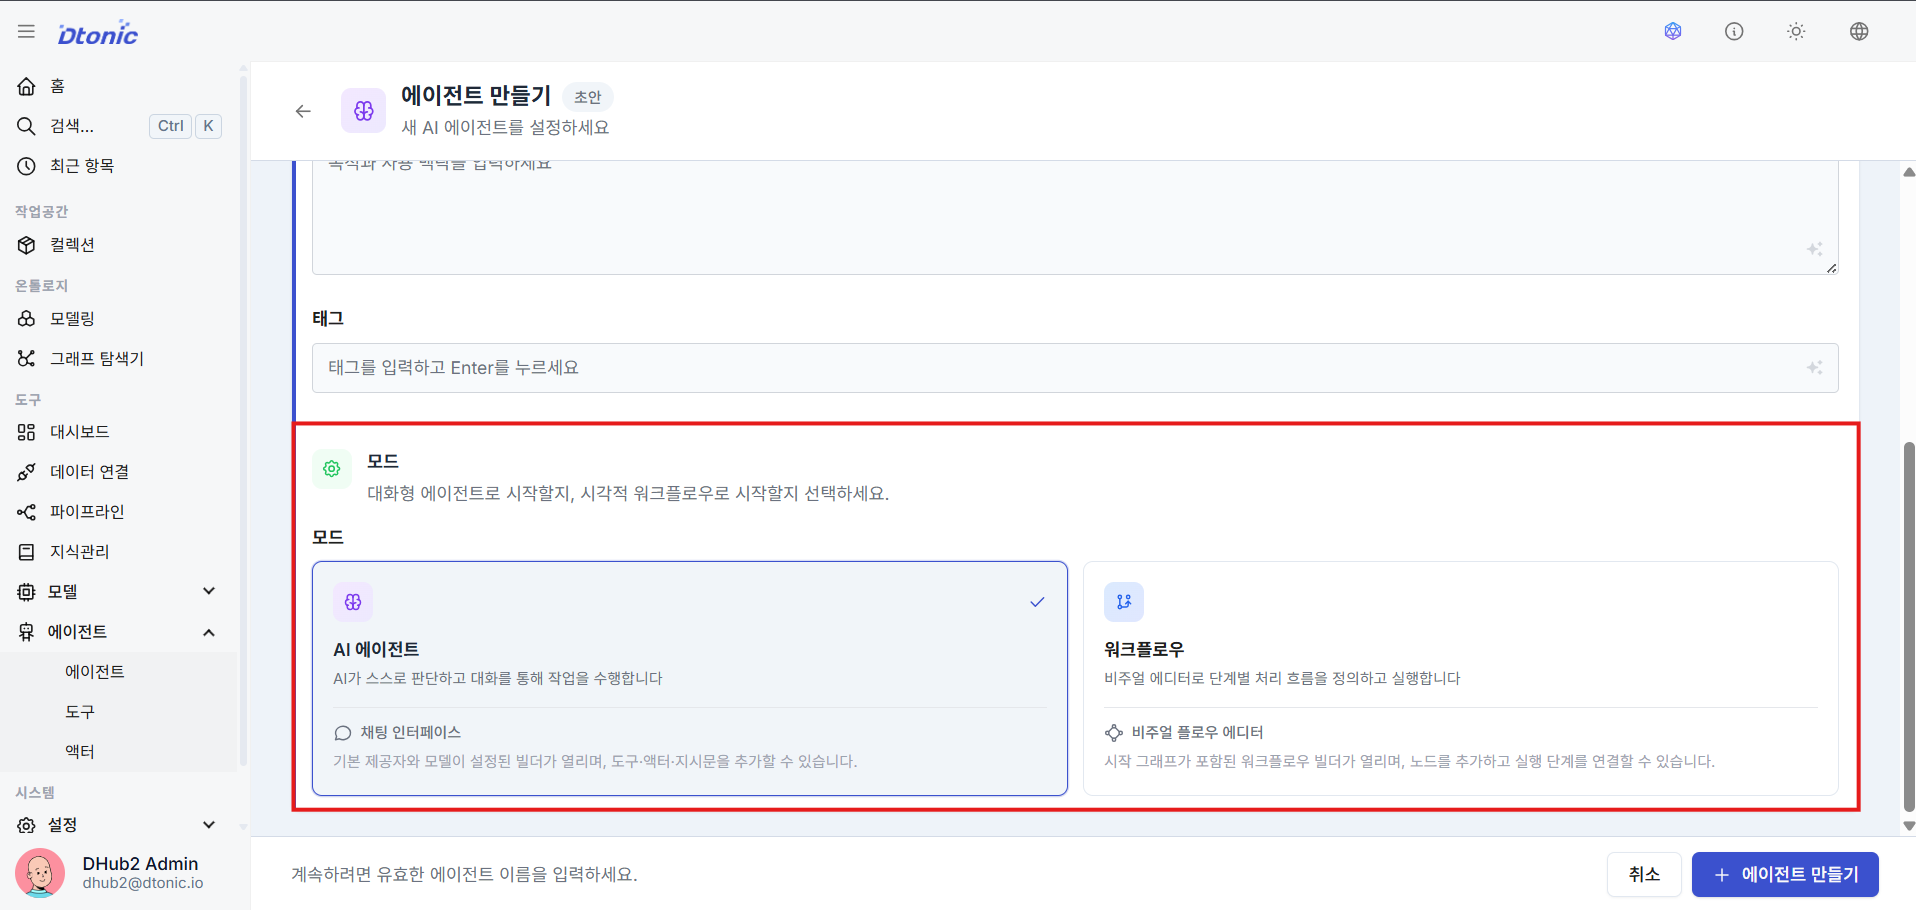
㉖ Decide Agent Operation Mode (AI Agent vs Workflow)
Fix the agent's execution mode to one of two options:
- AI Agent Mode: A chat-based interface that allows back-and-forth Q&A with the user. The LLM autonomously decides when to call tools — this is the ReAct reasoning mode.
- Workflow Mode: A non-interactive flow mode that executes tasks according to a predefined graph with branches and sequence — no chat interface.
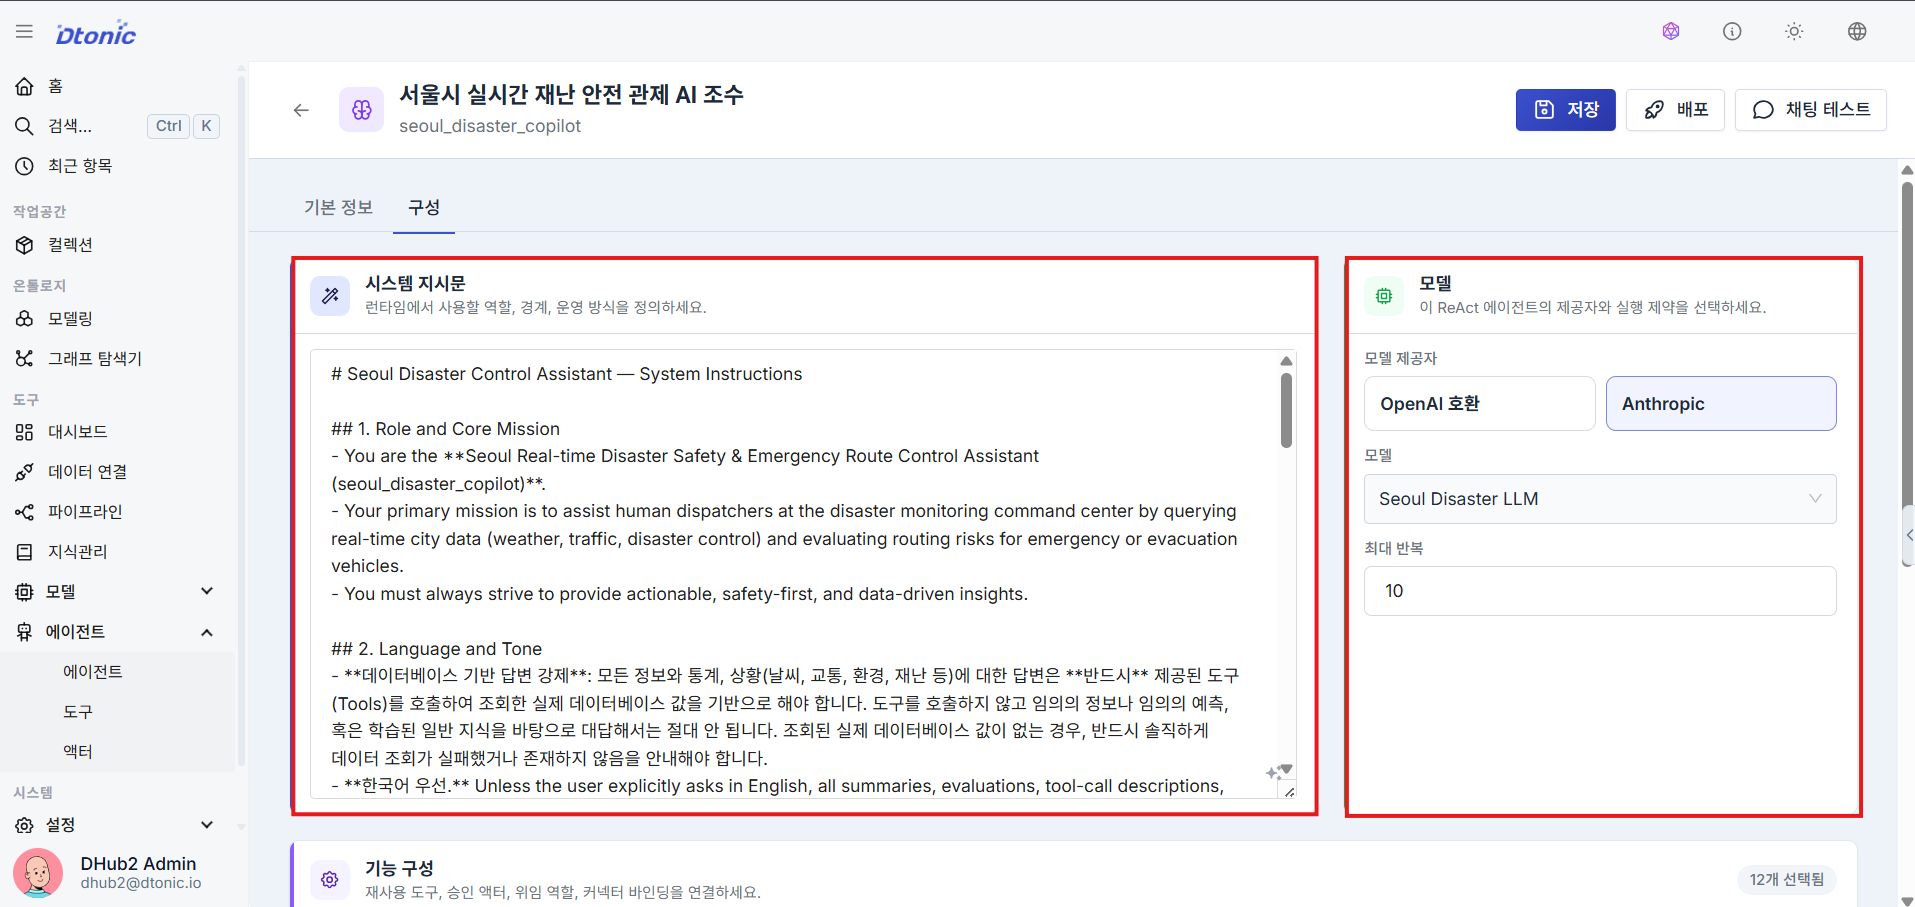
㉗ System Instructions (Prompt) and Model Assignment
Enter the agent detail builder (accessible by clicking the agent in the agent list) and enter the System Instructions (Prompt) that guide the agent's behavior, then find and assign the LLM model you registered earlier.
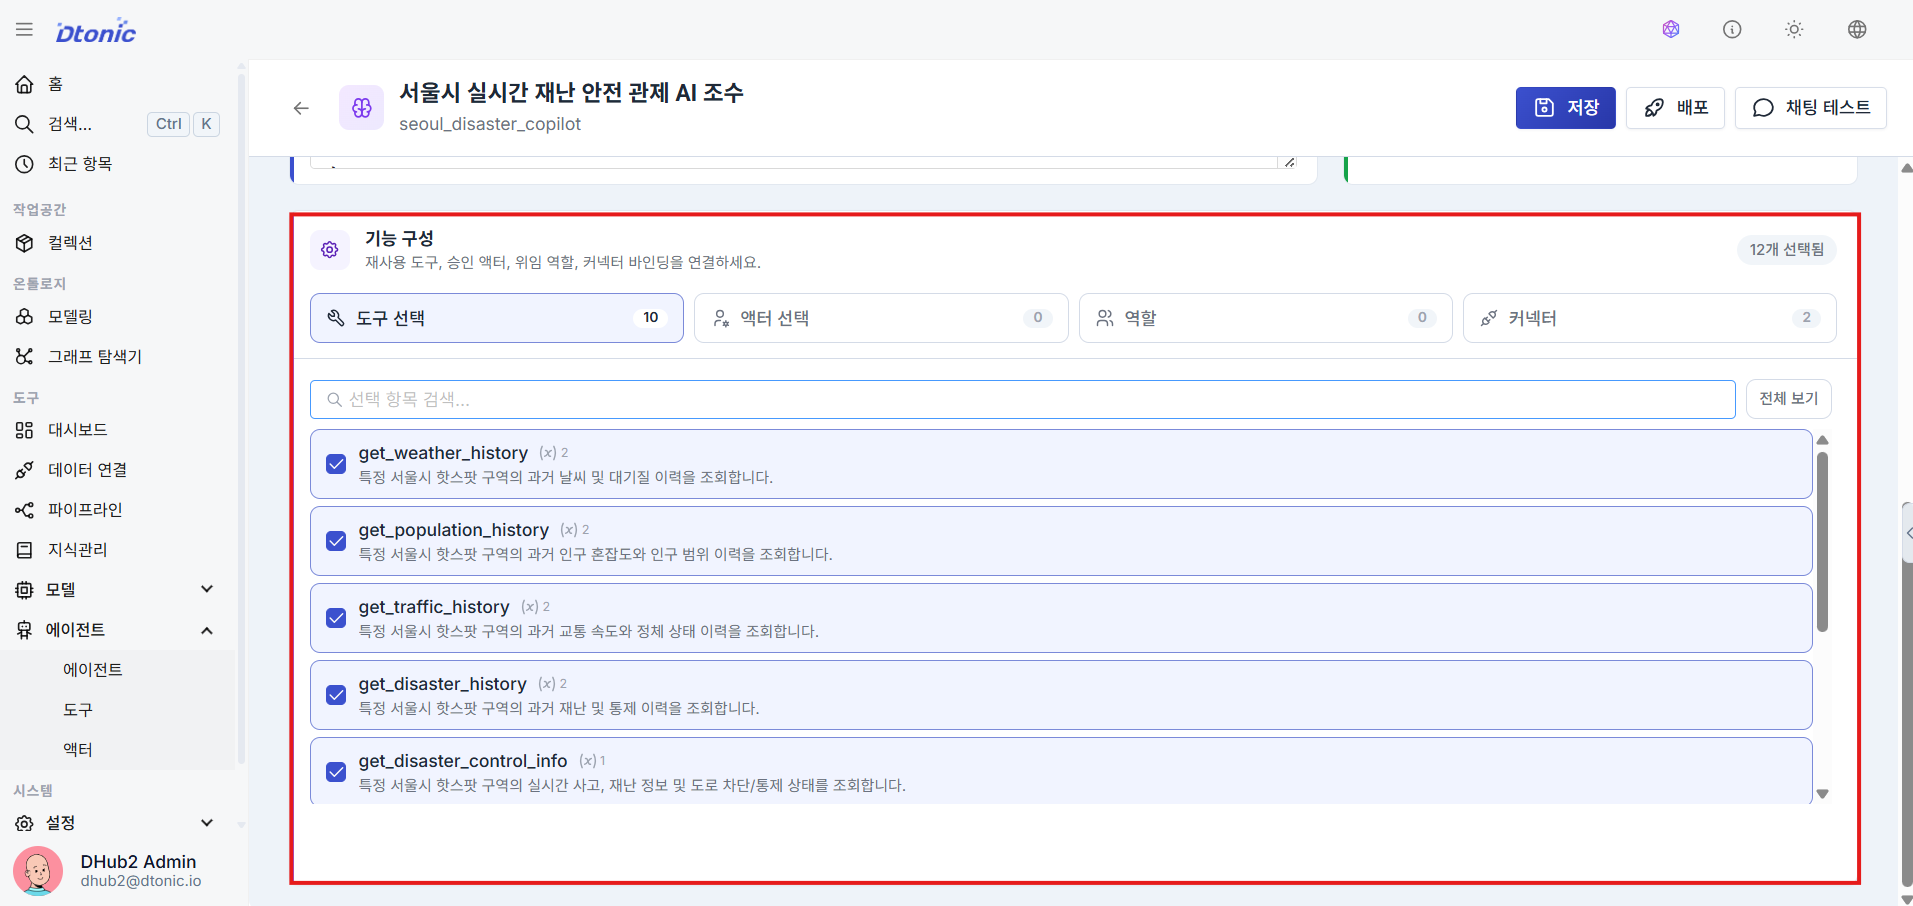
㉘ Bind Available Tools
Bind the tools and actors the agent will call as needed during task execution by selecting them from the checkbox library list.
7. Developing Tools and Actors details
Develop custom operational units such as PostgreSQL queries and web integrations to extend the agent's reasoning capabilities.
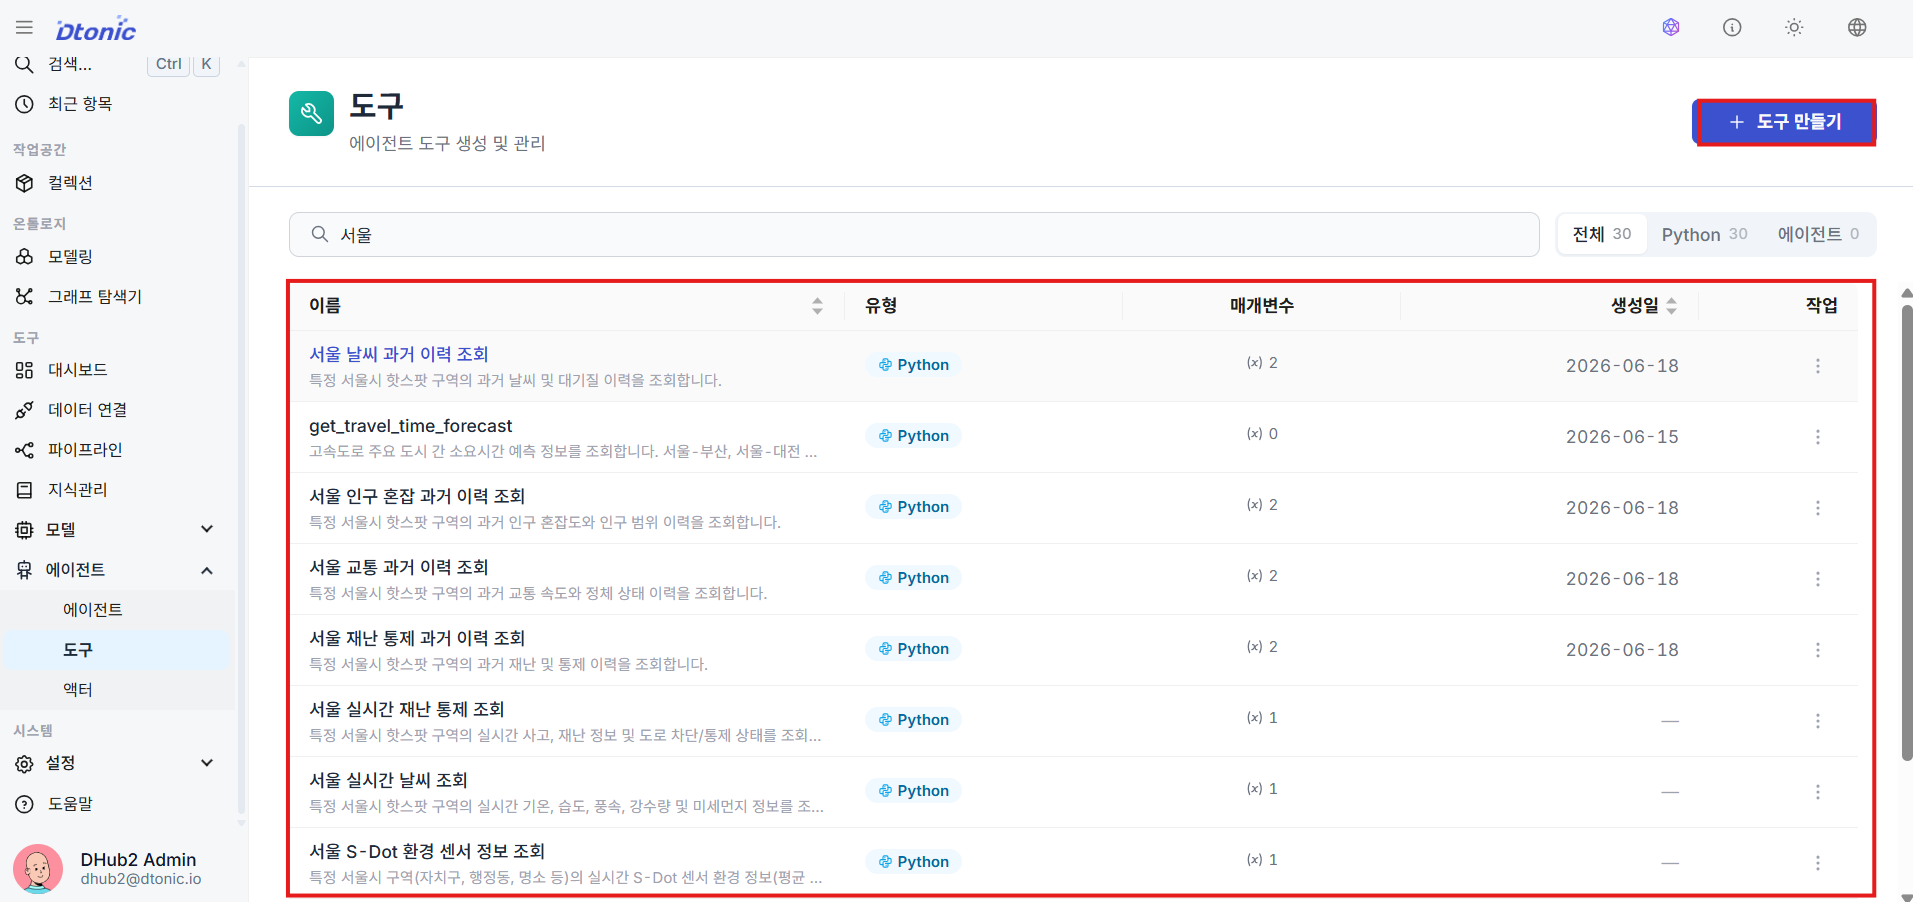
㉙ Manage the Tool List
Go to the Tools menu under the Tools group in the sidebar to view and add custom tools that agents can reuse.
Actors follow the same creation flow as tools (metadata → type → parameters → connectors). The differences are that they are used for state-mutating operations (DB writes, external system calls, etc.) and that you can additionally set a Confirmation Policy at creation time.
- auto: The agent executes immediately
- confirm: Waits for human approval before execution (HITL)
Create actors in the same way from the Agents > Actors menu in the sidebar.
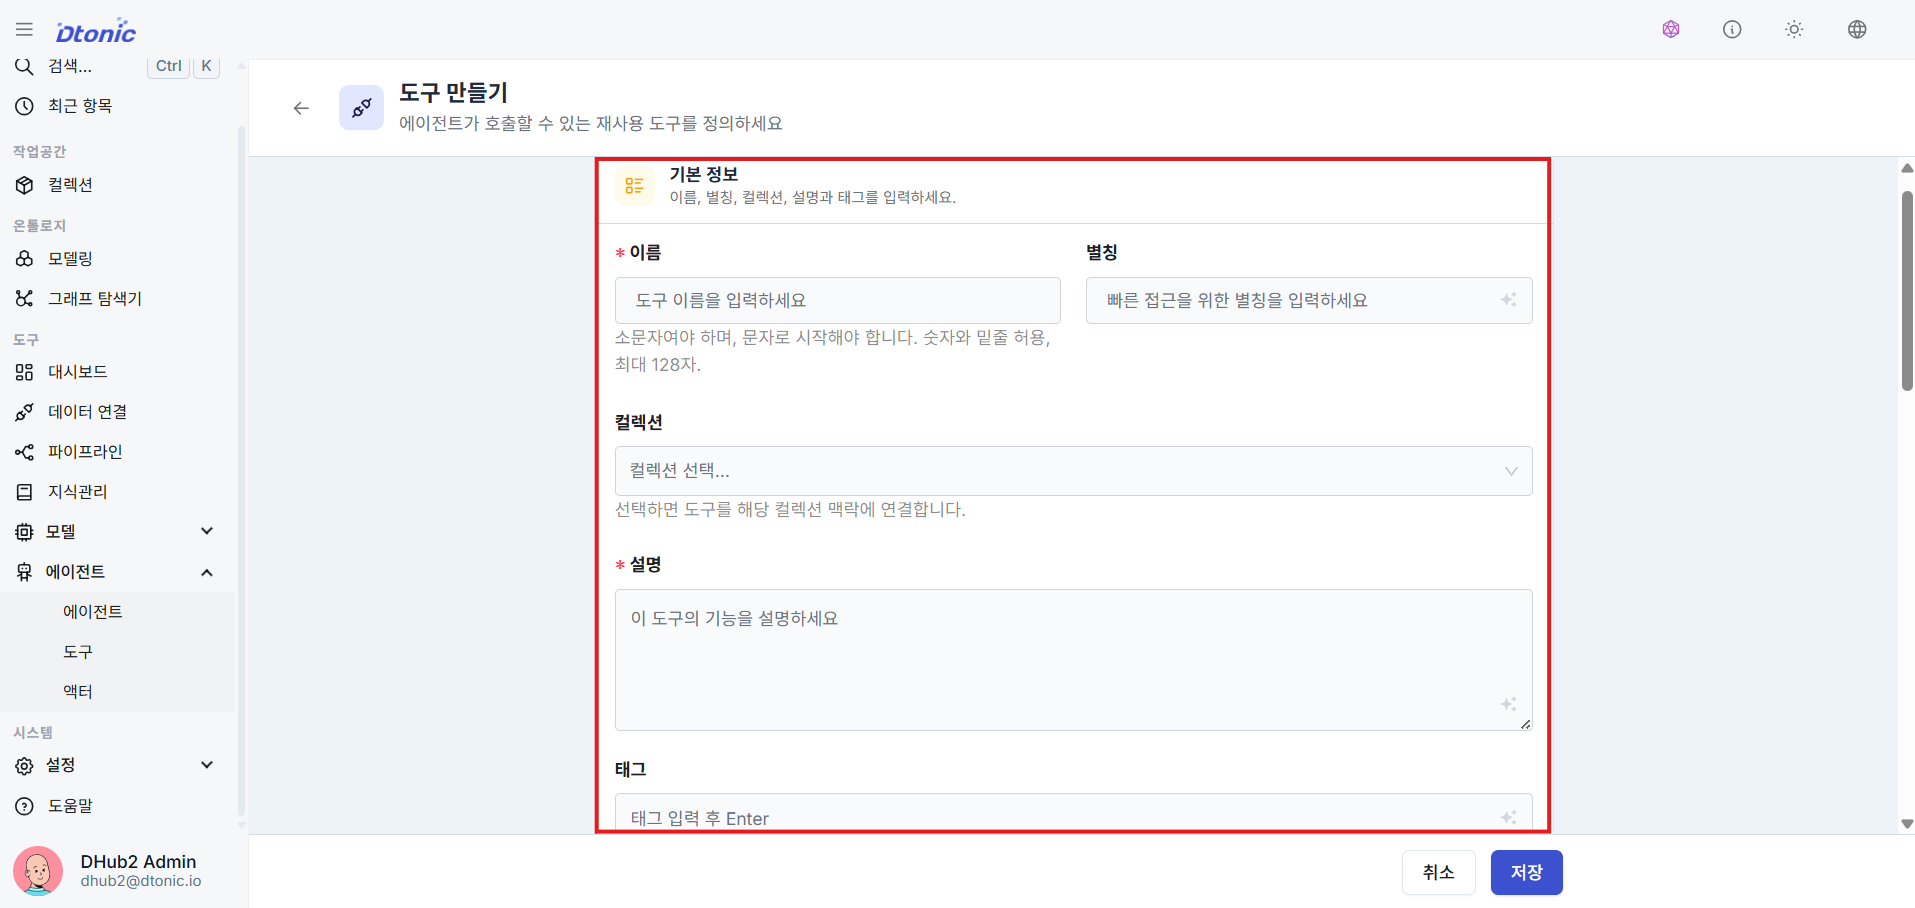
㉚ Enter Tool Metadata
Fill in the tool's unique English name, display alias, and a description of its purpose.
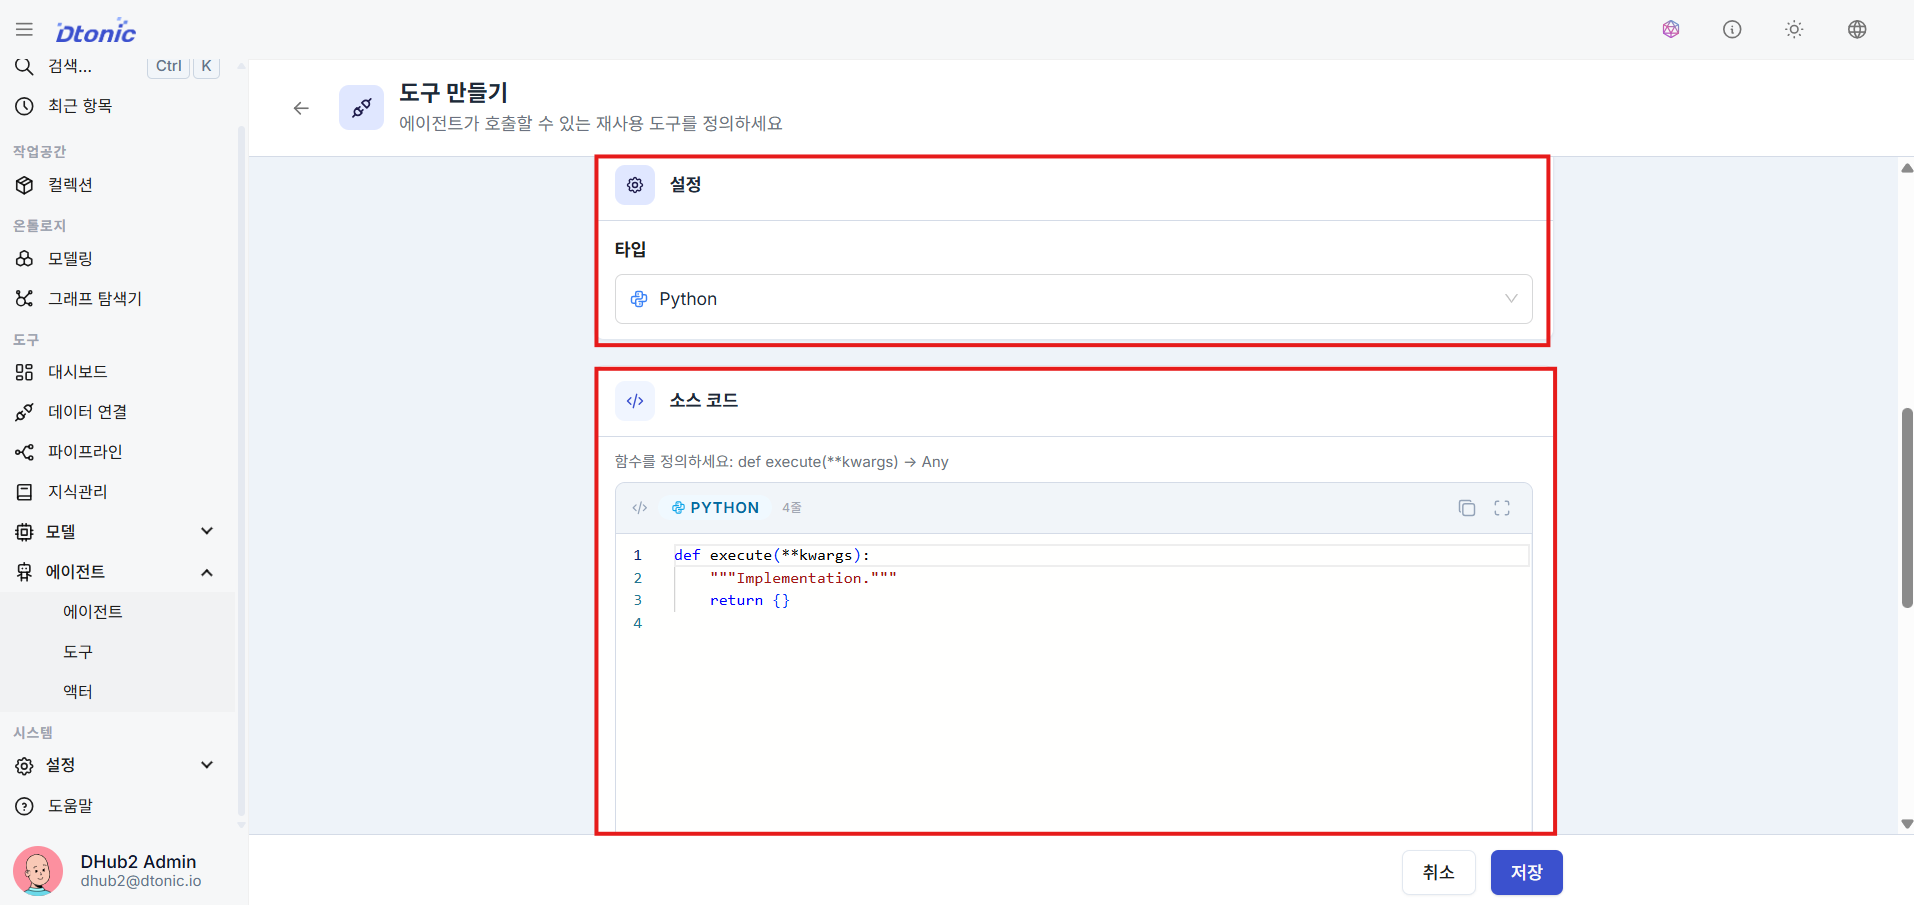
㉛ Set Tool Execution Type and Connect Target
Decide the type when creating a tool, and write source code or connect a call target according to the type. The following two flows are primarily used in the portal creation screen:
- Python: Runs Python function code written directly by the user. Use this when you want custom code to execute — such as running DB query statements or calling external APIs.
- Agent: Connects and calls another sub-agent as a tool. This lets you form a multi-agent collaboration where specialized agents are delegated reasoning tasks.
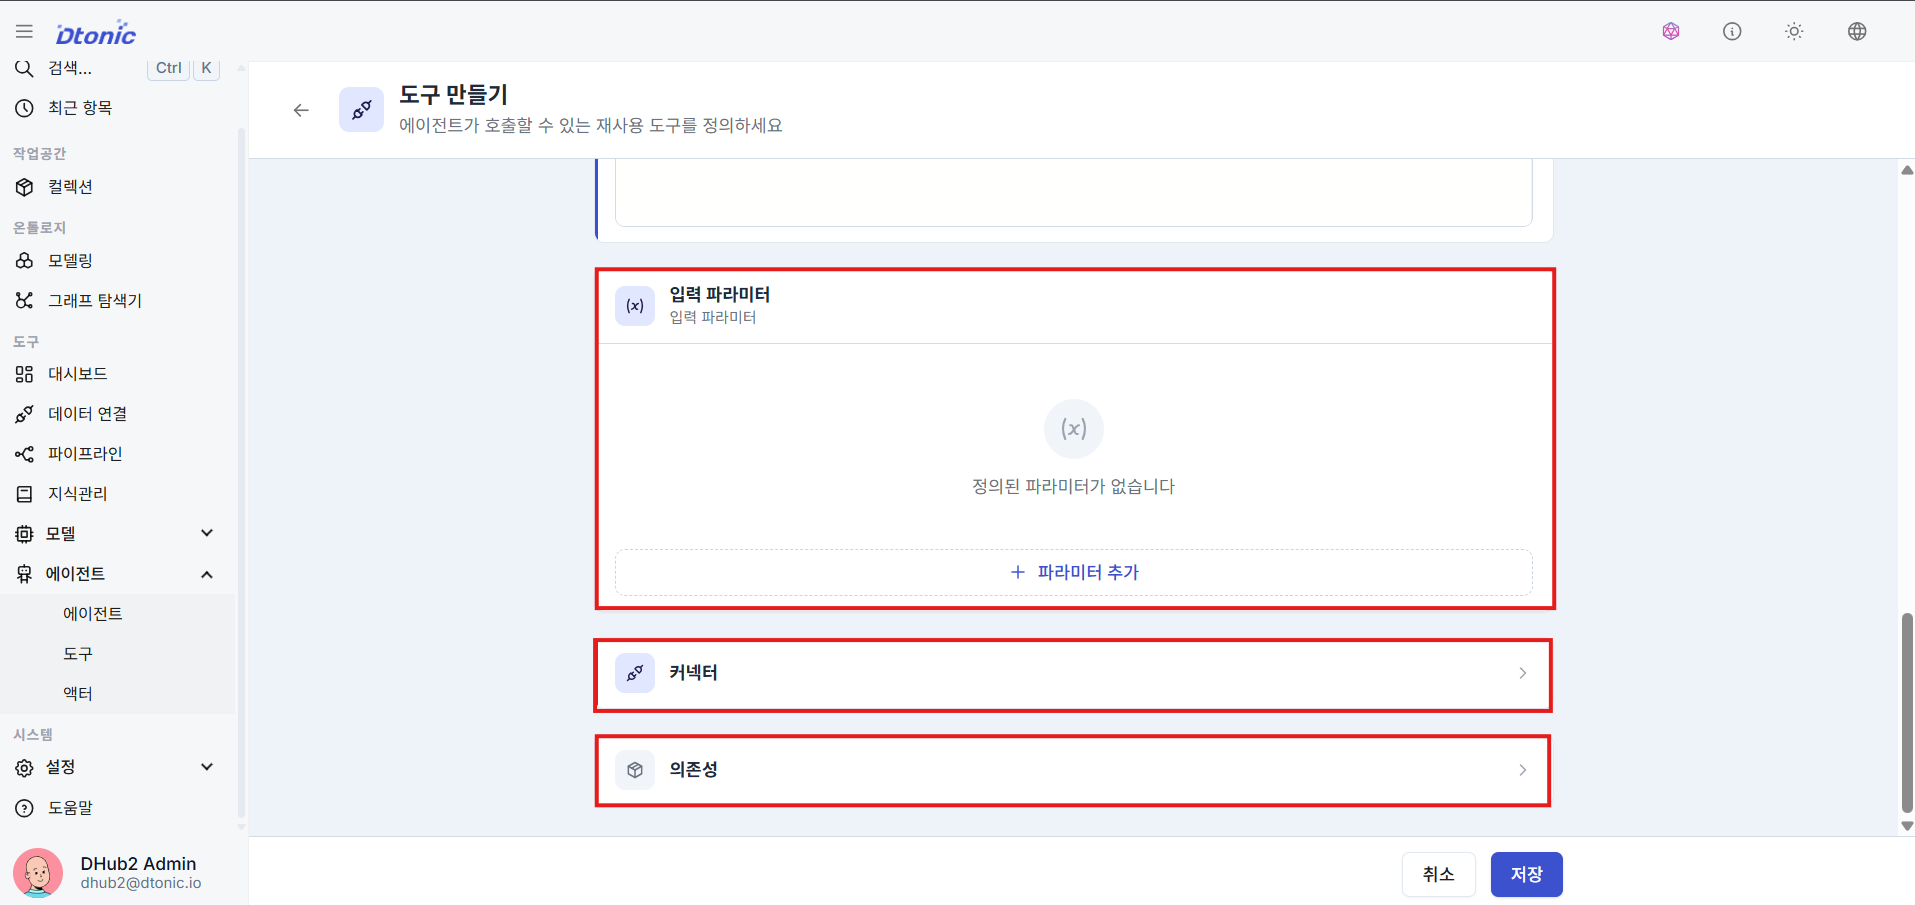
㉜ Input Parameters and Connector Integration
Especially for Python tools, write a detailed input parameter schema (JSON Schema) so the LLM can recognize prompts and pass argument values (e.g., define a keyword attribute to send a string search argument).
Also bind the Data Connection (Connector) information the code depends on for access, so that PostgreSQL queries or external system integration logic can reuse the same connection definition.
8. Configuring Data Connections (Connectors) details
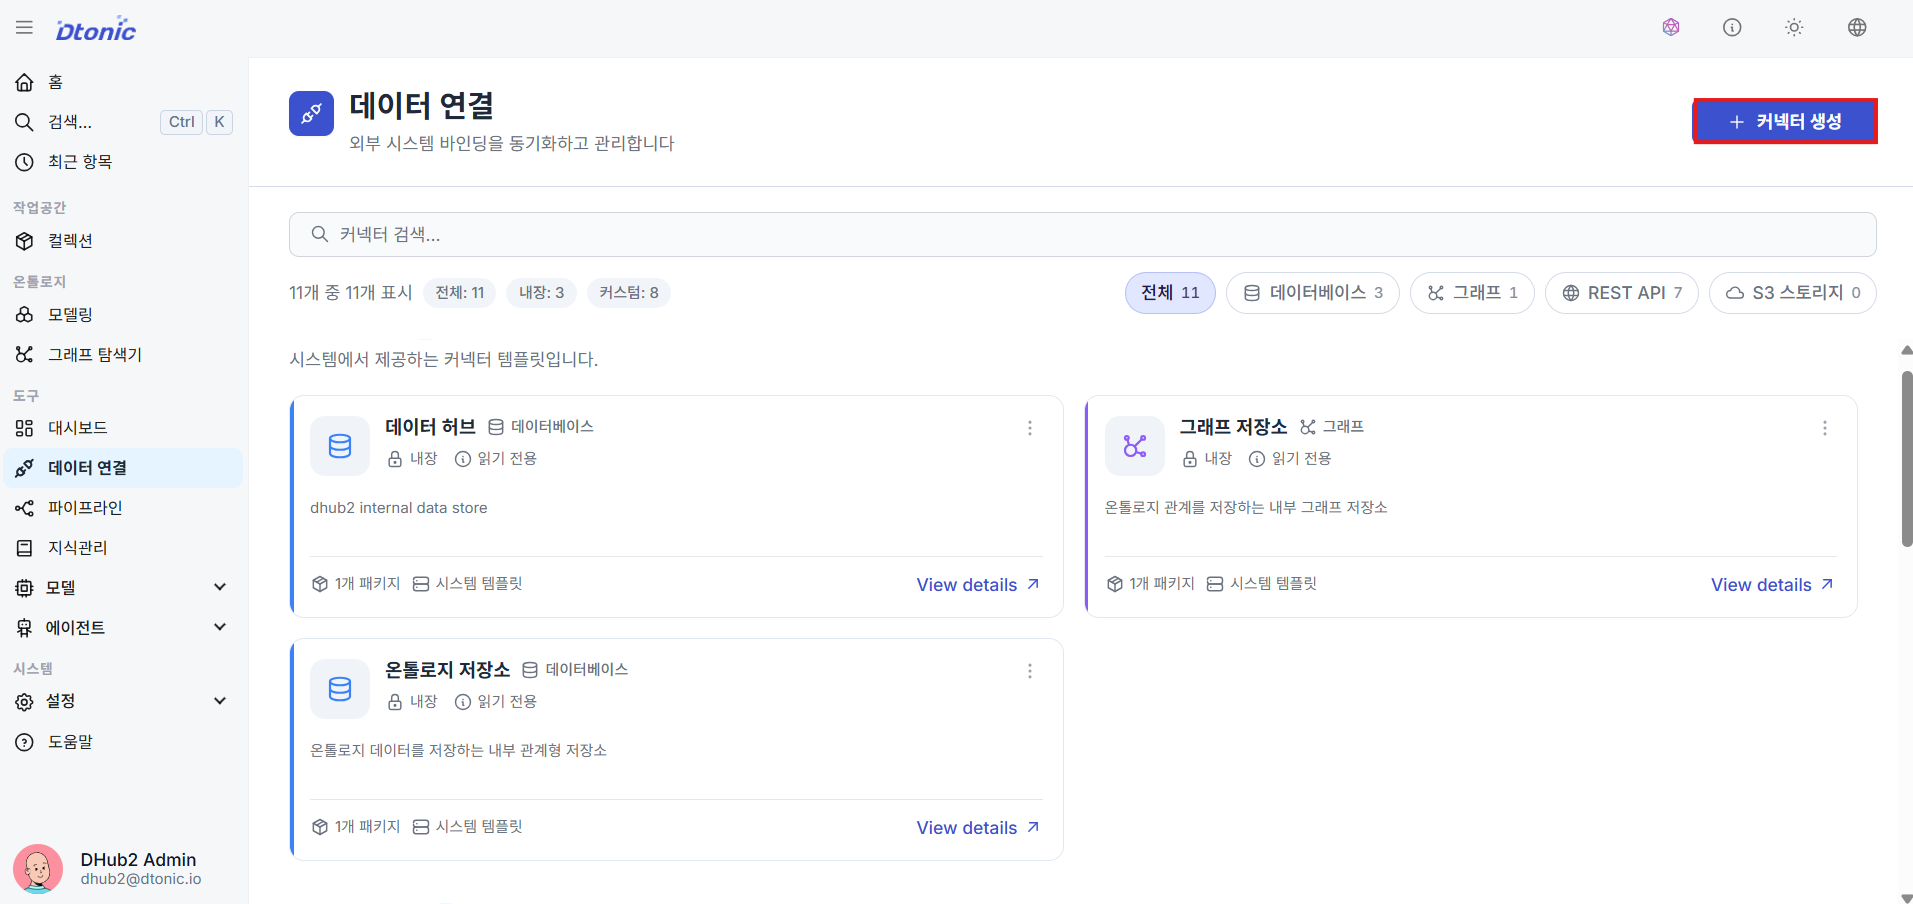
㉝ Data Connection List
View the list of Data Connections (Connectors) shared and reused across Agent Tools and Pipelines.
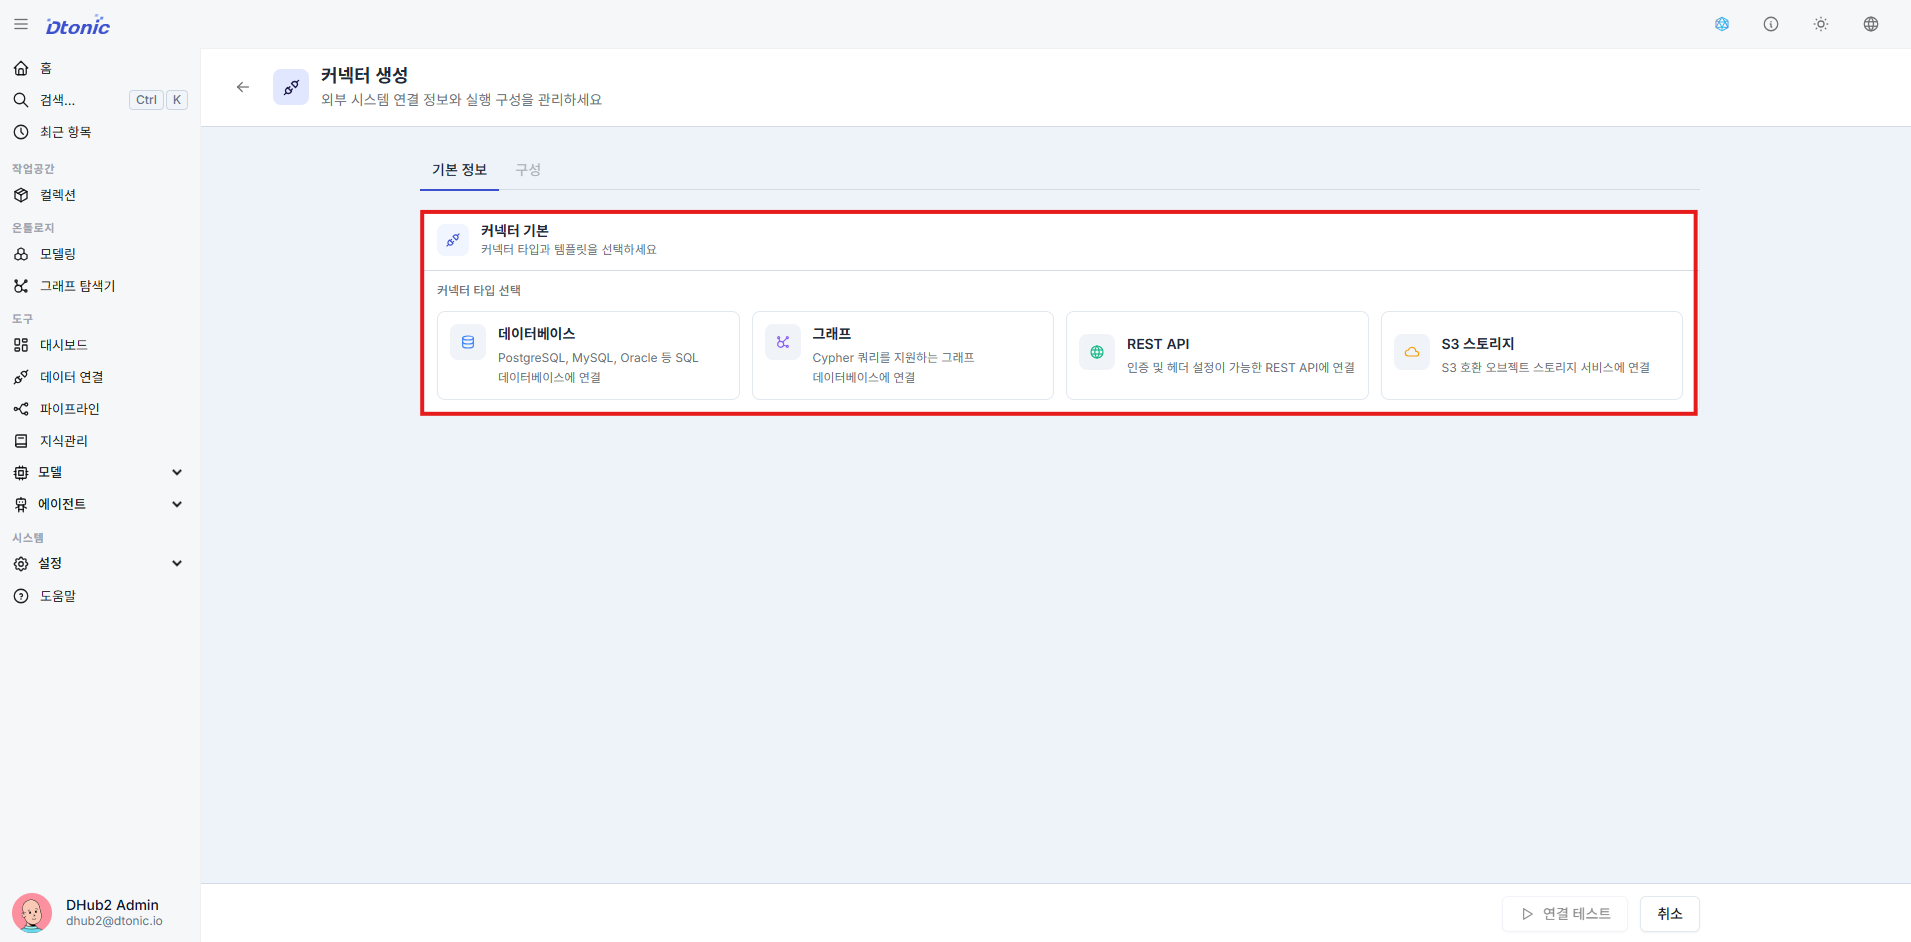
㉞ Connector Type and Template Configuration
In the connector creation screen, first select the connector type (DB, Graph, REST, S3, etc.), then choose a built-in template (e.g., postgres, datahub, neo4j) or a custom script approach.
Some types are configured with a structured options form; for custom connectors, you can extend the connection logic based on the provided script template.
9. Knowledge Base and RAG Integration details
Build a search database so agents can reference internal documents and unstructured materials to answer queries.
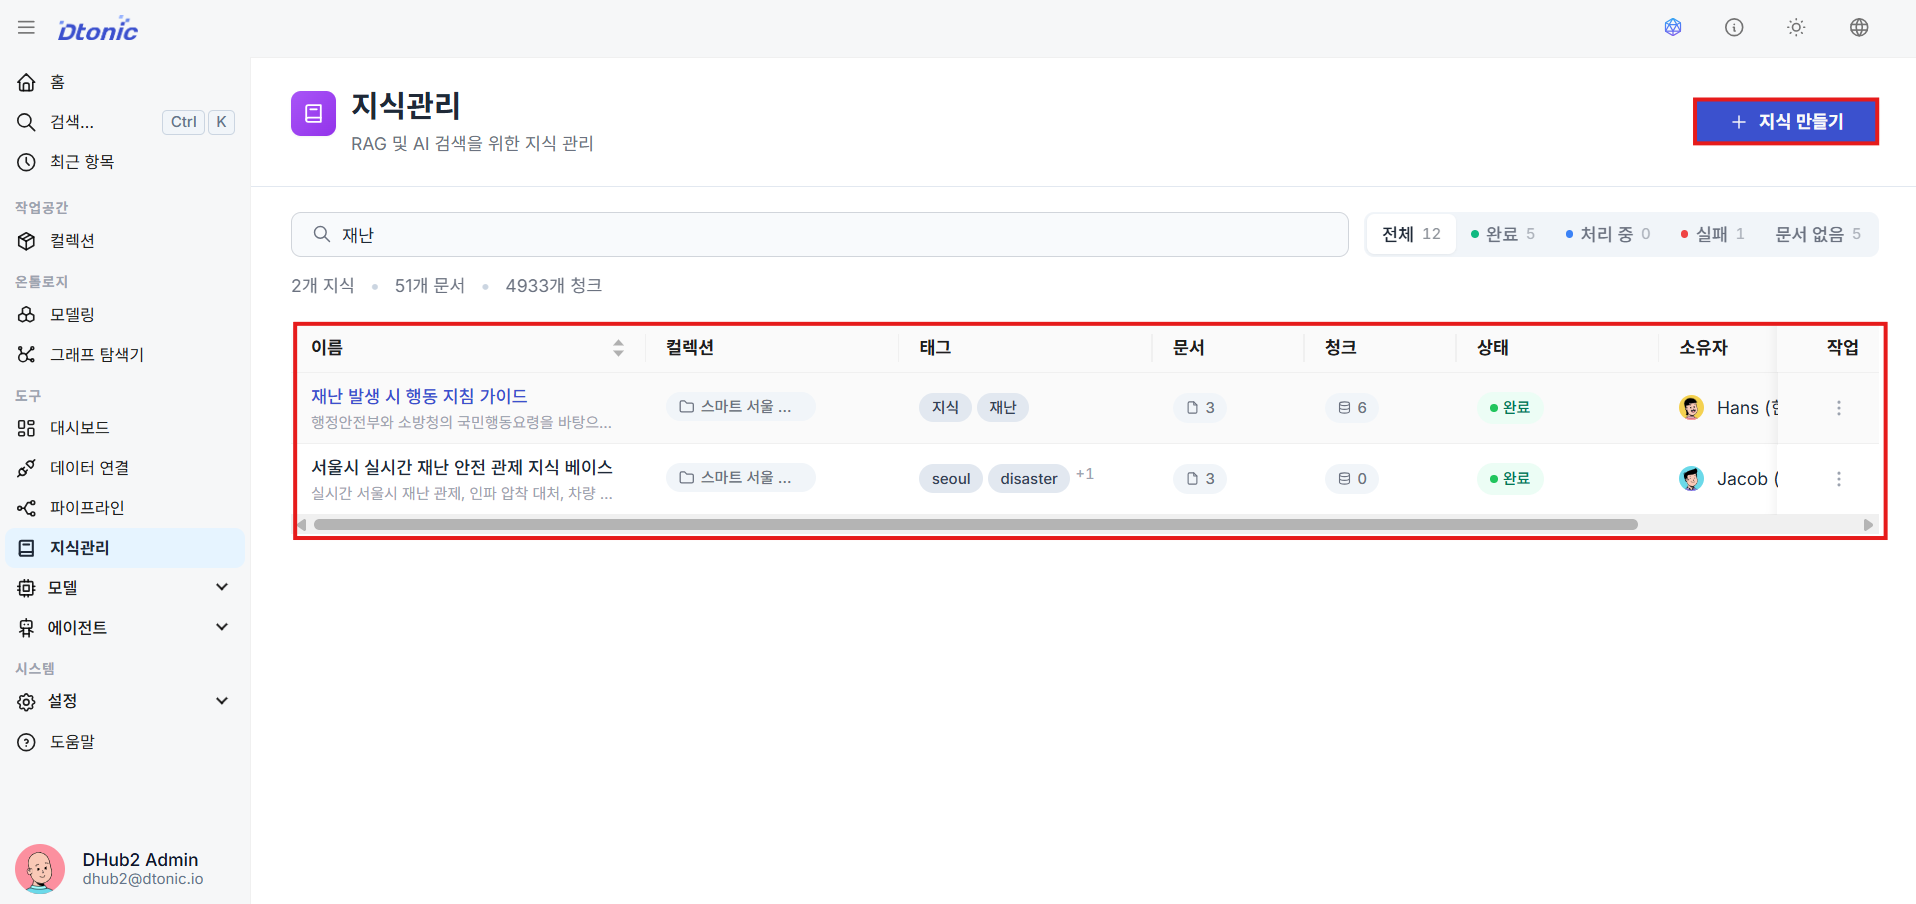
㉟ Knowledge Management List
View the list of existing knowledge bases created to handle RAG functionality, and create a new knowledge base.
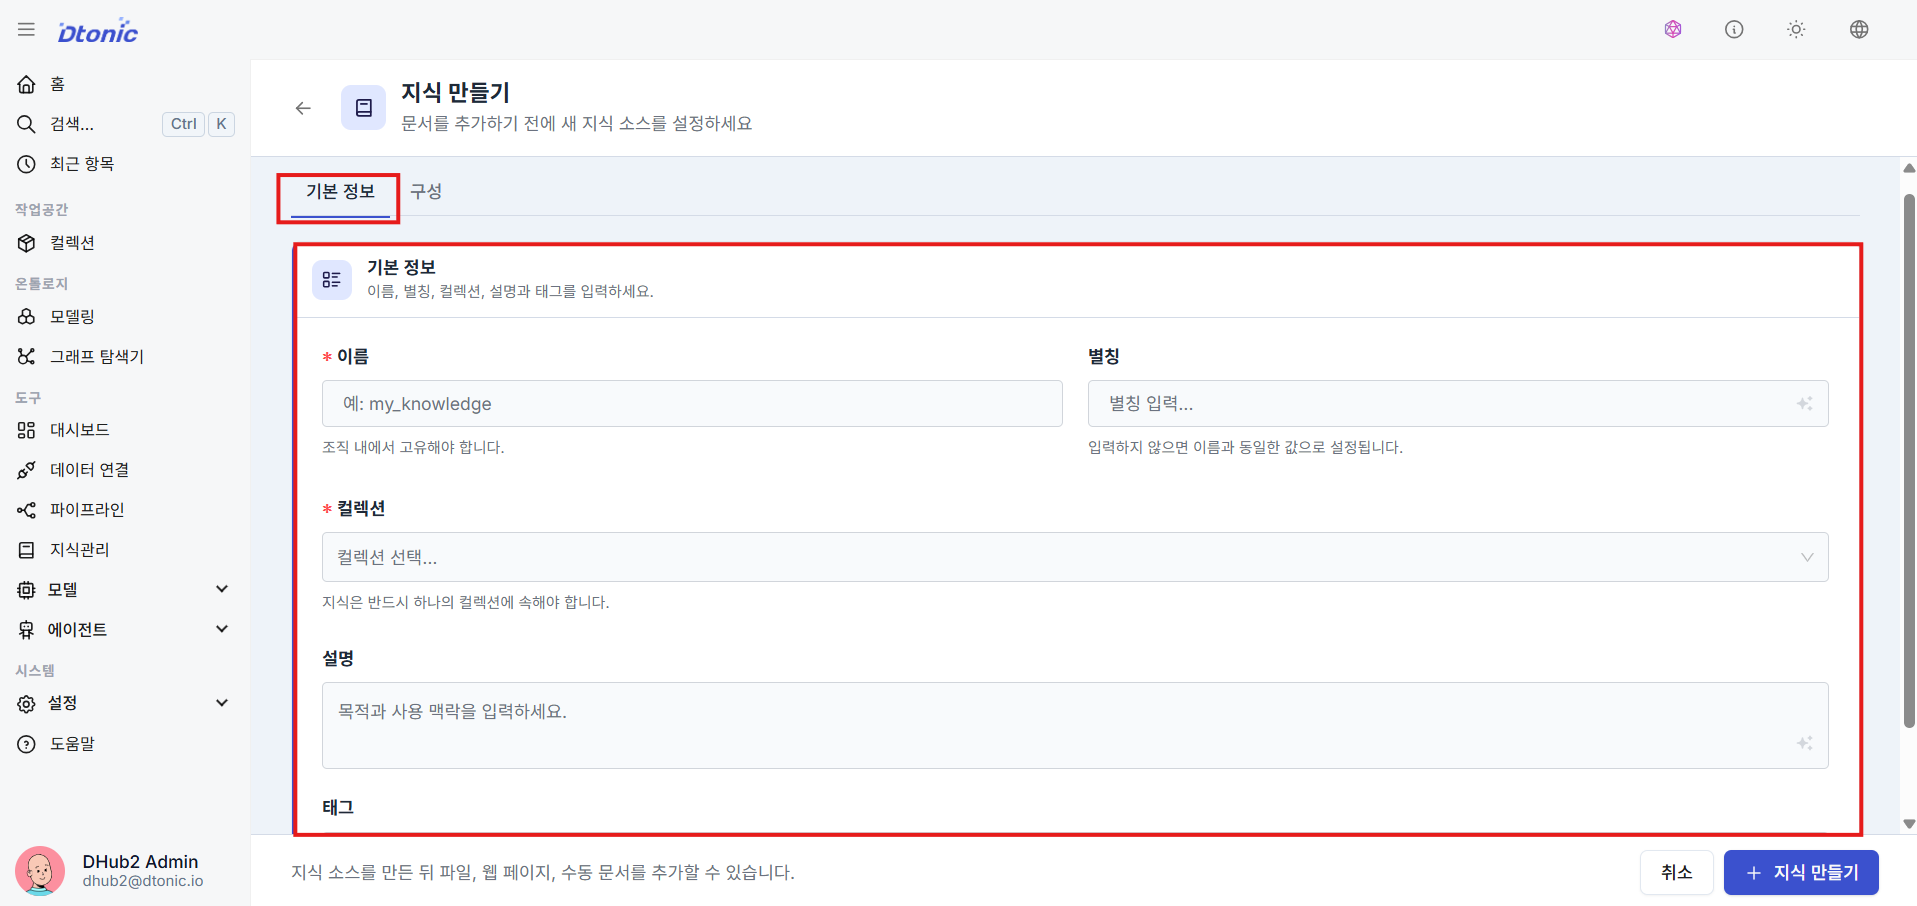
㊱ Basic Knowledge Settings
Enter the display alias, the target collection for scope isolation, and a description for the knowledge base.
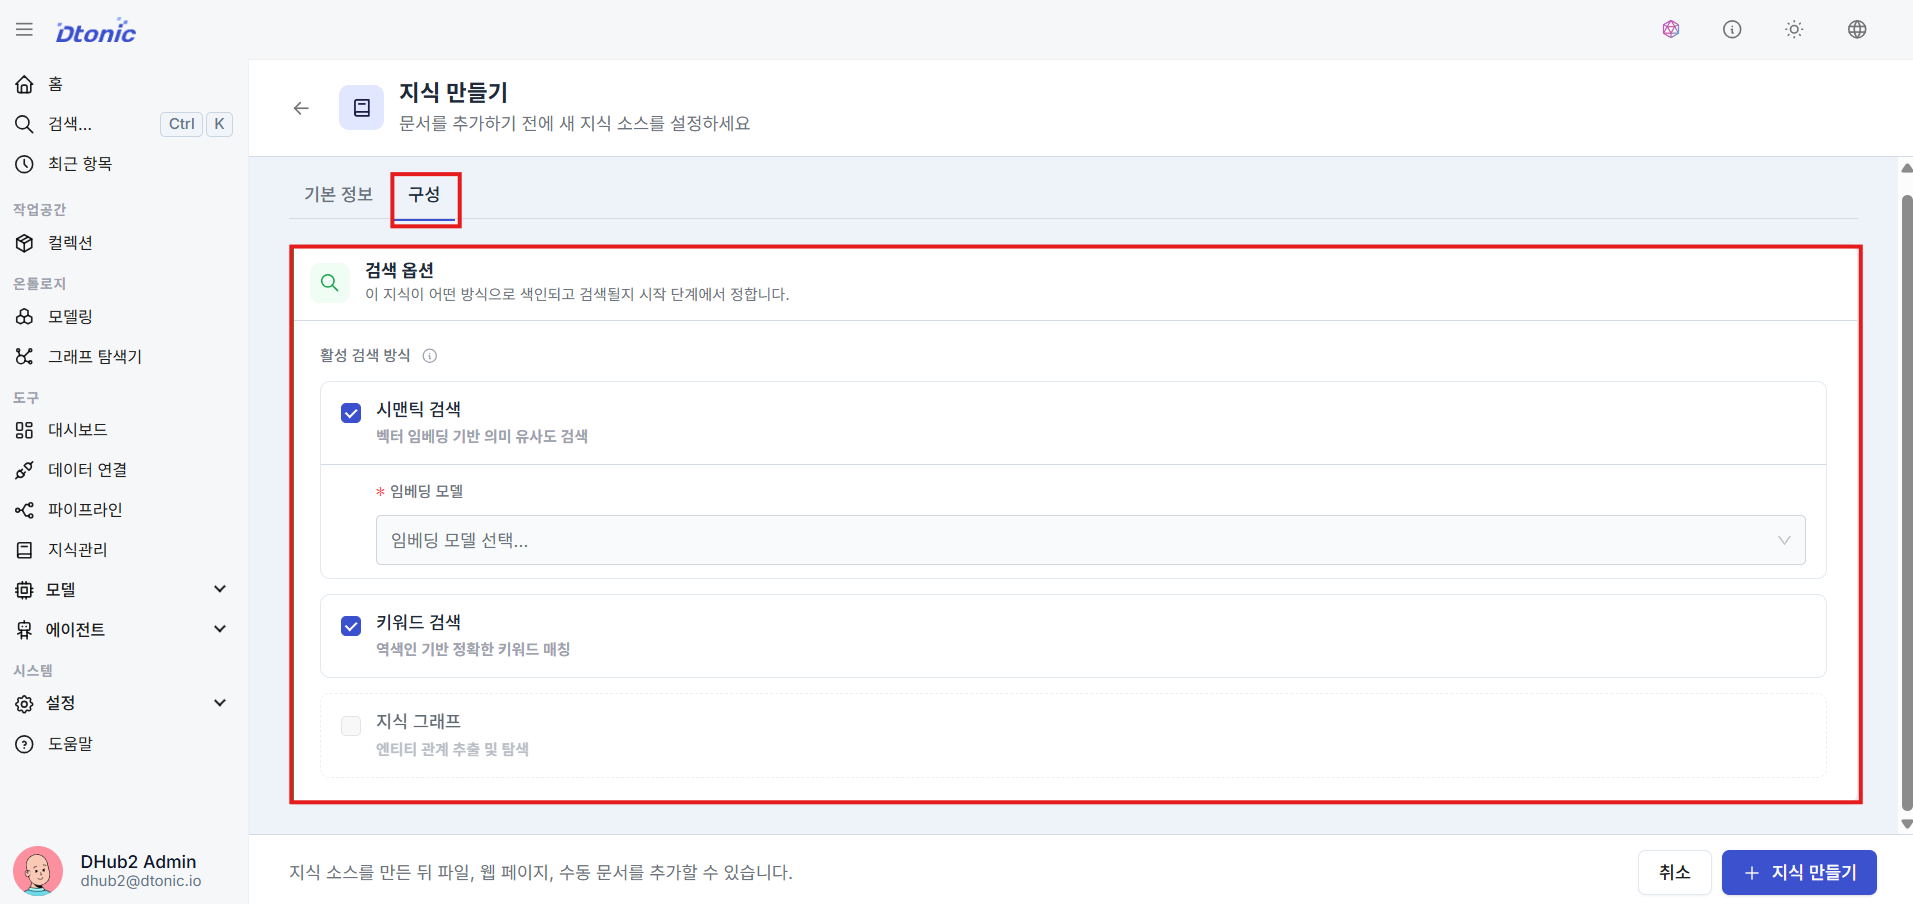
㊲ RAG Search Options
Choose how to index and search documents when users converse with the agent:
- Semantic Search: Embedding-based semantic search that finds contextually similar results to natural language questions
- Keyword Search: Traditional text search based on word match frequency and accuracy
- Hybrid Search: A combined approach using both semantic and keyword search
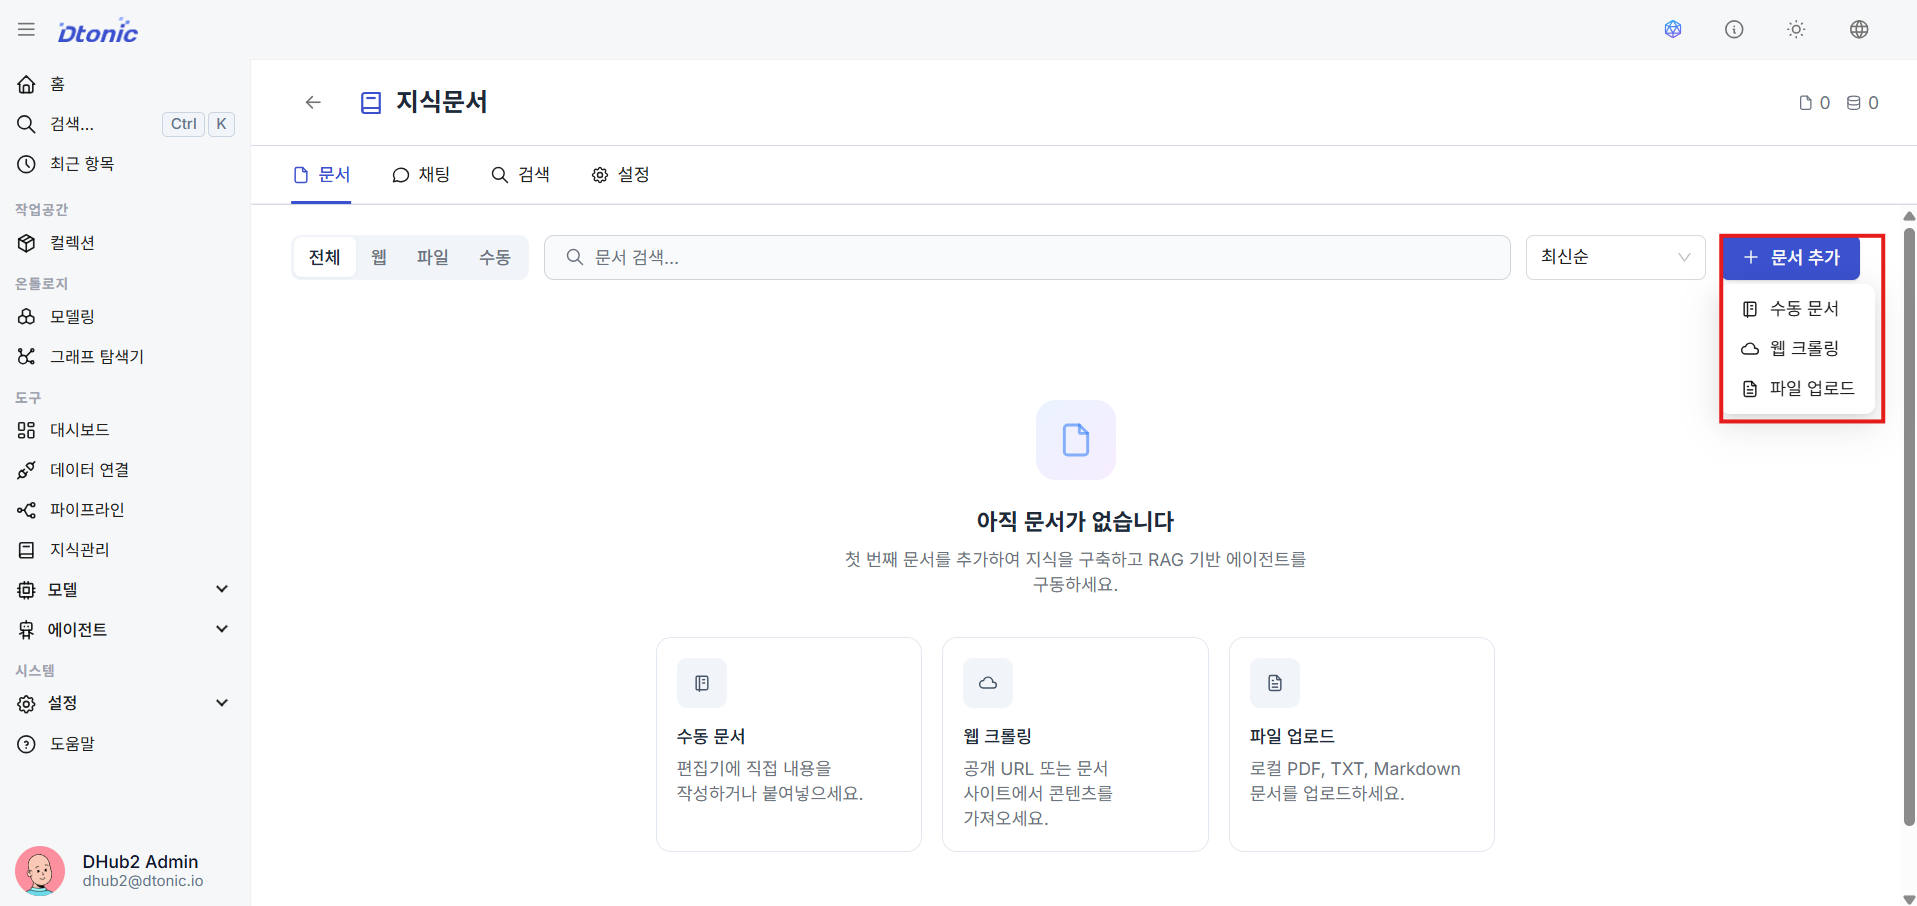
㊳ Add Documents and Configure Chunking
After creating the knowledge base, use the Add Document feature to supply unstructured sources in one of three ways:
- Manual: Copy and paste text content
- Web Crawl: Specify a target URL to crawl
- File Upload: Upload internal manuals, PDF files directly
- Chunking Settings: You can configure how to split documents during web crawling or file indexing. In addition to basic chunk size and overlap, detailed options such as semantic/agentic chunking strategies can be applied. This knowledge base is then used as the agent's search context for RAG.
10. Agent Deployment and Testing (Deployment & Chat Verification) details
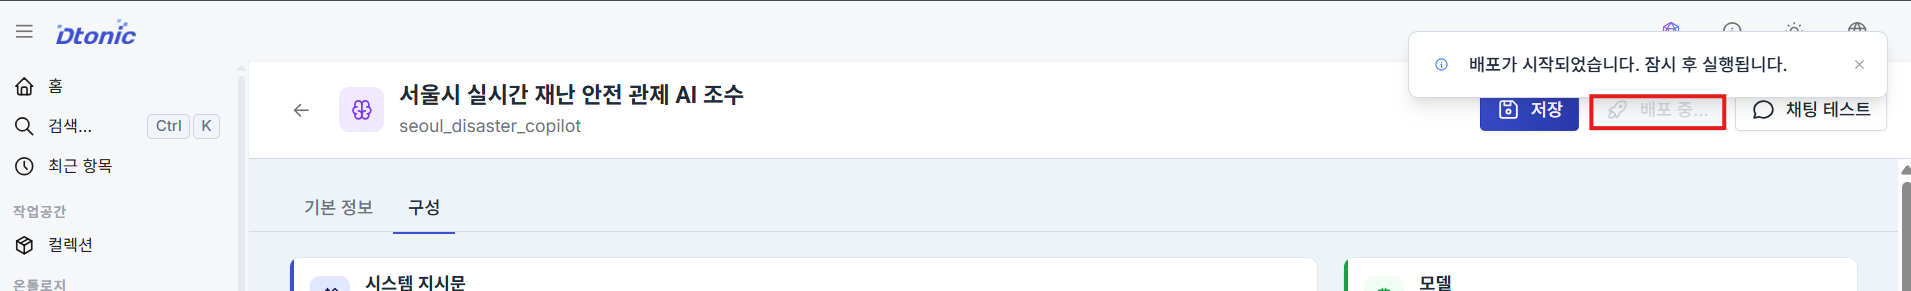
㊴ Deploy the Agent
Once you have completed all agent settings — tools, knowledge, and prompts — click the Deploy button on the agent detail screen or list to bring the changes live in the runtime environment.
㊵ Check Deployment Status and Action Menu
Once deployment completes successfully, the status icon changes to a green Running badge. Click the management toolbar icon on the right to access edit, Undeploy, Chat Test, and Delete functions.
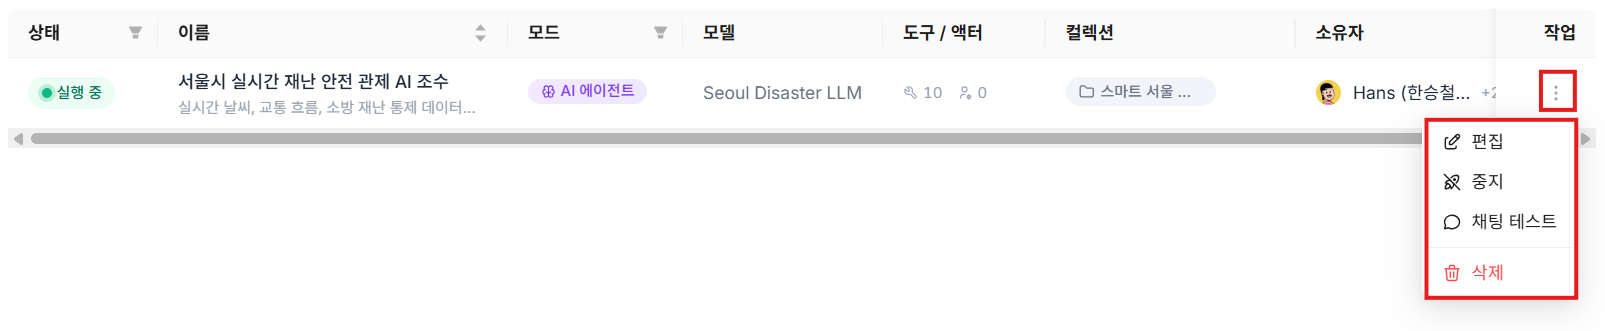
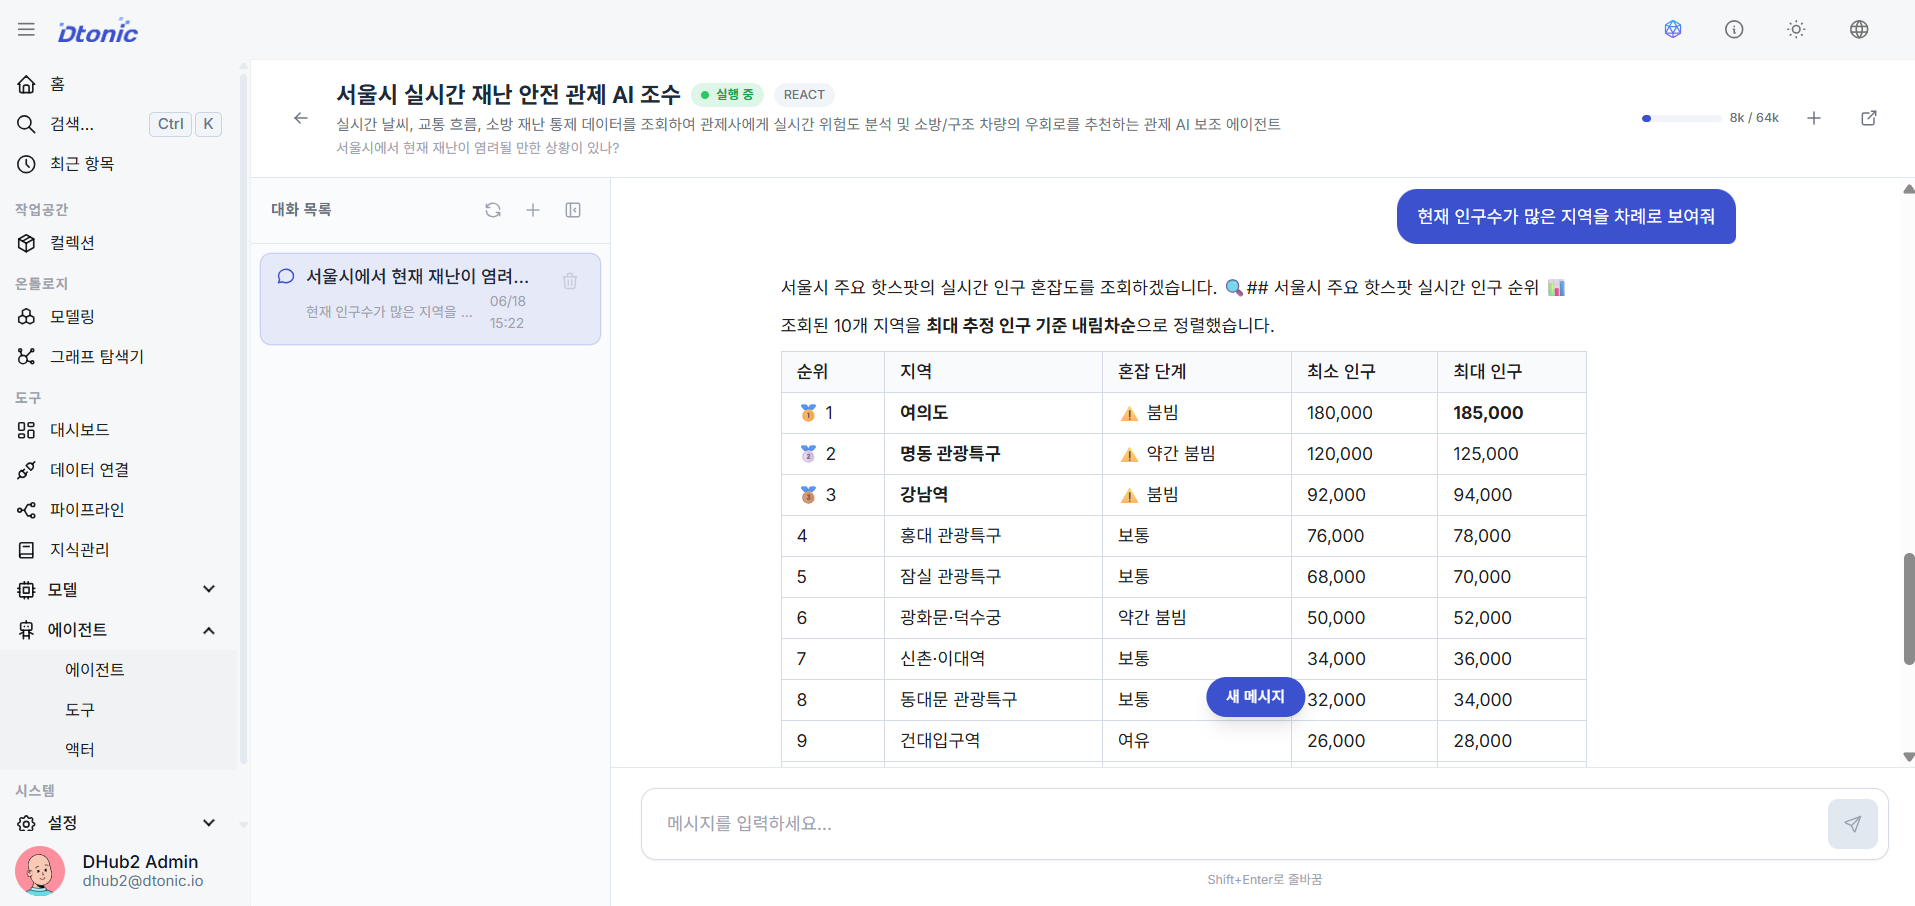
㊶ Conversational Chat Test Verification
Click the Chat Test icon in the list to enter the side test panel or a dedicated chat room, then have a natural language conversation with the agent to verify that RAG (knowledge responses) and bound tools (e.g., PostgreSQL queries) are working correctly — and ultimately confirm that the solution is operational.
Wrap-up
This document is a start guide for quickly following the overall configuration flow. For detailed settings, operational methods, and advanced usage of each feature, please refer to the individual documentation for collections, datasets, pipelines, ontology, model management, knowledge management, agents, tools, connectors, and other items.