Create a dashboard from CSV data
Upload a CSV file to a collection and connect it to a map widget. When you finish, the uploaded clinic locations appear on a dashboard.
Prerequisites
- A D.Hub account
- A CSV file containing location data
To follow this tutorial, use the clinics.csv sample. It contains latitude and longitude columns.
1. Sign in
- Open the D.Hub portal.
- Enter your email and password.
- Select Sign in.
In an environment that uses SSO, select SSO sign-in and use your organization account. See Troubleshoot sign-in if you cannot sign in.
2. Create a collection
- Open Collections from the sidebar.
- Select Create collection.
- Enter
my_first_projectunder Name on the single-page form. - Select Create.
Name is required. Complete Alias, Description, and Tags in the same dialog only if needed.
After creation, my_first_project is selected automatically and its detail screen opens. Add assets such as datasets with Add item after creating the collection.
3. Upload the CSV file
- Continue from the automatically opened
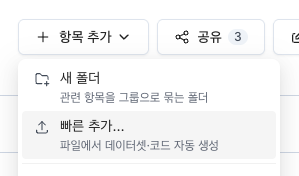
my_first_projectcollection detail screen. - Select + Add Item ▾, then select Quick Add....
- Drop
clinics.csvinto the upload area or choose it in the file picker. - Confirm that the preview contains
latitudeandlongitudecolumns.
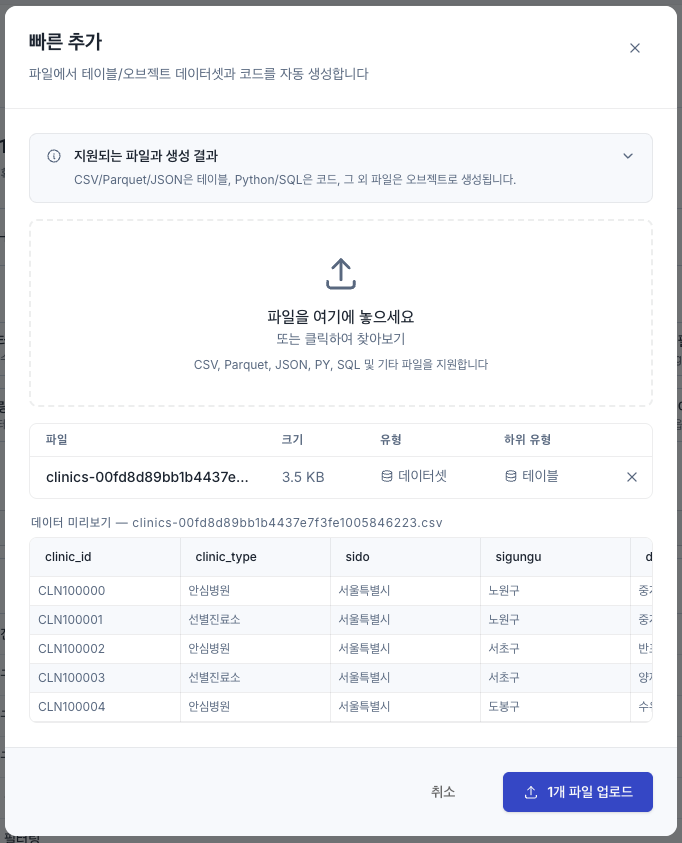
- Select Upload 1 file.
When the upload finishes, the result list contains the clinics dataset. If a file fails, review the reason in the same list.
4. Create a map dashboard
- Open Dashboards from the sidebar.
- Select Create at the top right of the list.
- Choose the
my_first_projectcollection as the save location and select Continue. - Enter
Clinic locationsas the dashboard name. - Select Map in the Widget Library.
- Under Analysis Source in Widget settings, select the
clinicsdataset. - Set the latitude field to
latitudeand the longitude field tolongitude.
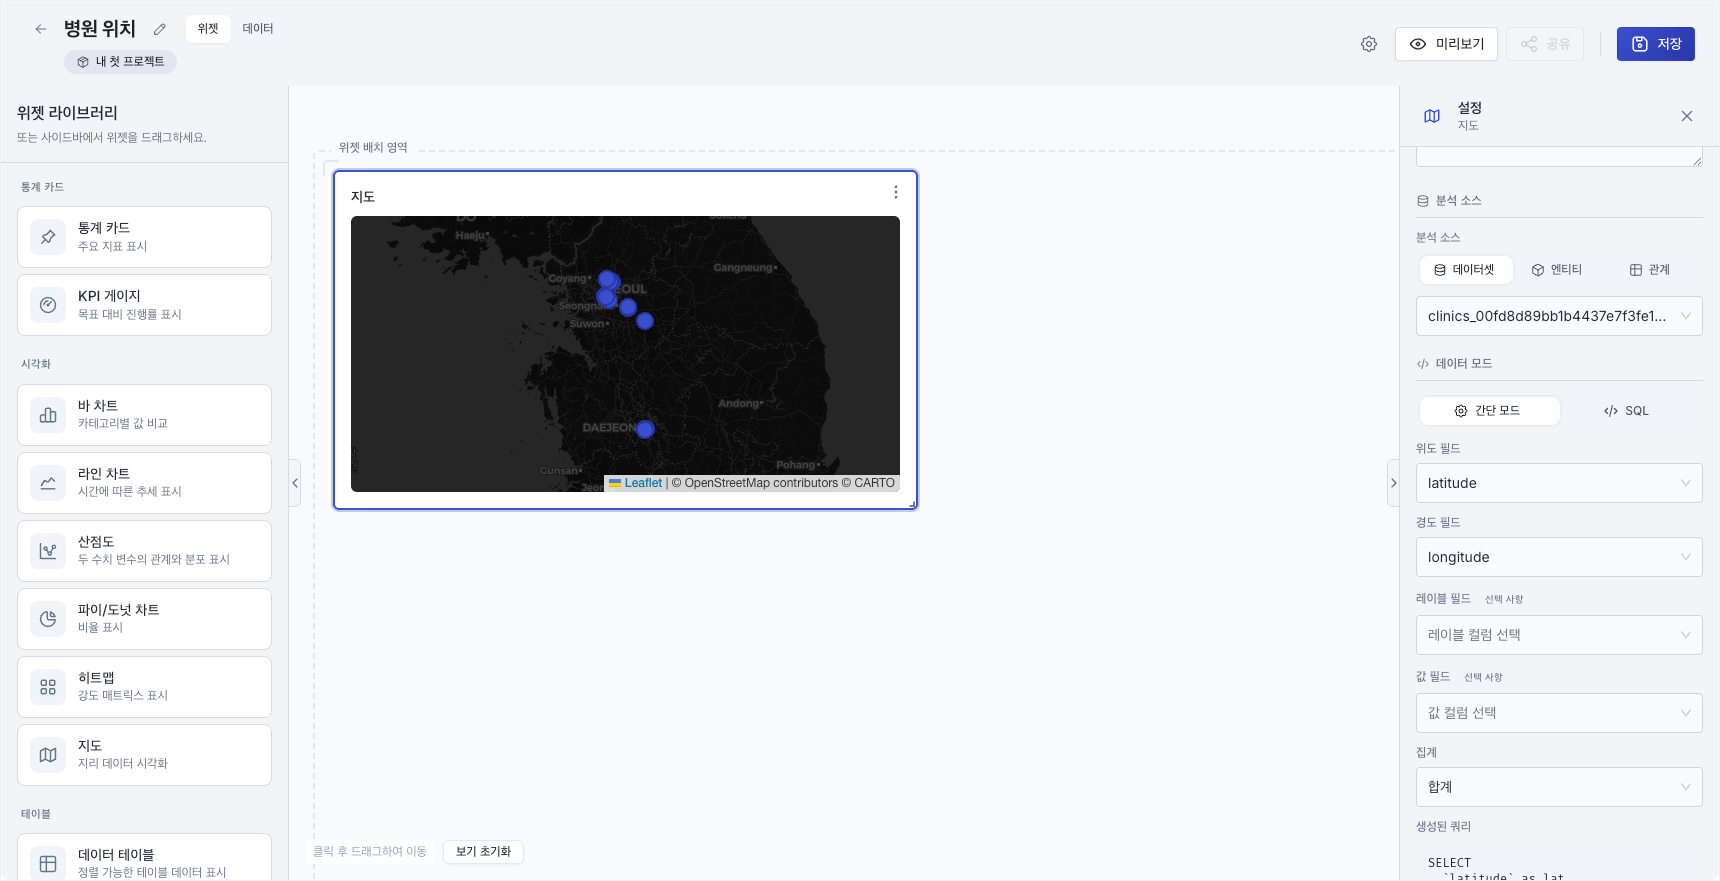
- When locations appear on the map, select Save.
Verify the result
The quick start is complete when all three results are present.
- The
my_first_projectcollection contains theclinicsdataset. - Location points appear on the map in the
Clinic locationsdashboard. - The saved widget and data connection remain after reopening the dashboard.
Continue learning
- Search the clinics data guide with Knowledge to search a Markdown document and review its source.
- Configure dashboard data to learn aggregation and SQL settings.
- Choose a role-based Learning Center course: Analyst · Data Engineer · Administrator