Explore the first screen
Introducing the D.Hub screen configuration that you first encounter after logging in.
Screen composition
The D.Hub screen is largely divided into the left sidebar and the right main area.
Sidebar
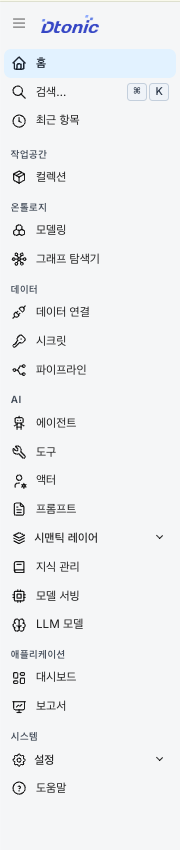
The sidebar on the left side of the screen consists of a Top Menu at the top and six business sections below it. Section headers (Workspace, Ontology, Data, AI, Application, System) are labels that group related functions and are not objects to be moved by clicking.
1. Top menu
This is a common menu that sits at the top of the sidebar without section headers.
- Home: Go to the home screen.
- search… (
⌘K/Ctrl+K): Global search at the top of the sidebar. Clicking it opens a search window that allows you to go directly to data assets as well as sidebar menus and pages. For detailed operations, refer to Global Search. - Recent Items: Go to a page where you can view recently viewed or worked assets.
2. Workspace
- Collection: A space where datasets, code, pipelines, knowledge, dashboards, and agents are grouped and managed into groups and folders. It is where resources actually reside and is also the reference point for authority and sharing.
3. Ontology
This section deals with the meaning and relationships of data.
- Modeling: An authoring tool that defines entities and relationships graphically on the screen.
- Graph Explorer: Explore the defined ontology graph by drawing it in the form of nodes (dots) and edges (connection lines).
4. Data
This section contains functions for pulling and processing external data.
- Data Connection: Connector management screen for connecting to external systems.
- Data Sync: Continuously apply PostgreSQL changes to another PostgreSQL database.
- Pipeline: Design, execute and monitor data processing workflows.
5. AI
This is the section where you create an agent and manage the resources and models that the agent will refer to. Previously, agent-related items were clustered into one submenu, but now the following items are spread out side by side within the section:
- Agent: A list/builder of agents that connects LLM and tools to automate tasks.
- Tools: Define and manage tools called by the agent.
- Actor: An actor that configures the agent to act in a specific role.
- Prompts: Manage reusable prompts (directives).
- Semantic Layer (submenu): Gathers 'semantic definition' resources used when asking for data in natural language. It consists of Table (a table defined in semantic units), Value Dictionary (a dictionary used within a collection that connects column values with the same meaning but written differently into one standard value), and Query Template (a query form that has been verified in advance).
- Knowledge: We collect unstructured documents and provide AI chat (RAG) that provides answers based on the contents.
- Model Serving: Deploys the model and provides it as an actual service (manager/administrator privileges).
6. Application
- Dashboard: Dashboard builder that visualizes data with widgets and charts.
7. System
- Monitoring (submenu): Review active dataset ingestion and Data Sync jobs under Run status. Administrators can also review platform backend System Status.
- Settings (sub menu): Consists of General settings, User·Group·OIDC Client·Secret (administrator only) and LLM Model (Manager·Administrator privileges) settings exposed depending on permissions.
- Help: Opens the help panel.
In some environments, additional Laboratory sections (e.g. Report Generation) may be exposed.
At the bottom of the sidebar you will see User Profile, click on it to go to settings or log out. Even when the sidebar is collapsed, you can access all menus using icons and tooltips.
Top area
Open global search from Search… in the sidebar, or press ⌘K / Ctrl+K. The top area displays the page title and page-specific tools such as filters and create buttons.
The service notice banner is displayed globally at the top of all protected pages, so you can see the same notice no matter which screen you are working on.
On management lists that provide an Owner filter, narrow results by the displayed owner values. The filter does not search arbitrary users outside the list.
For resizable columns, drag a header boundary to change its width. Double-click the boundary to reset only that column, or focus it with the keyboard and use ← / →. Widths are saved in the current browser and are not included in shared URLs.
Home screen configuration
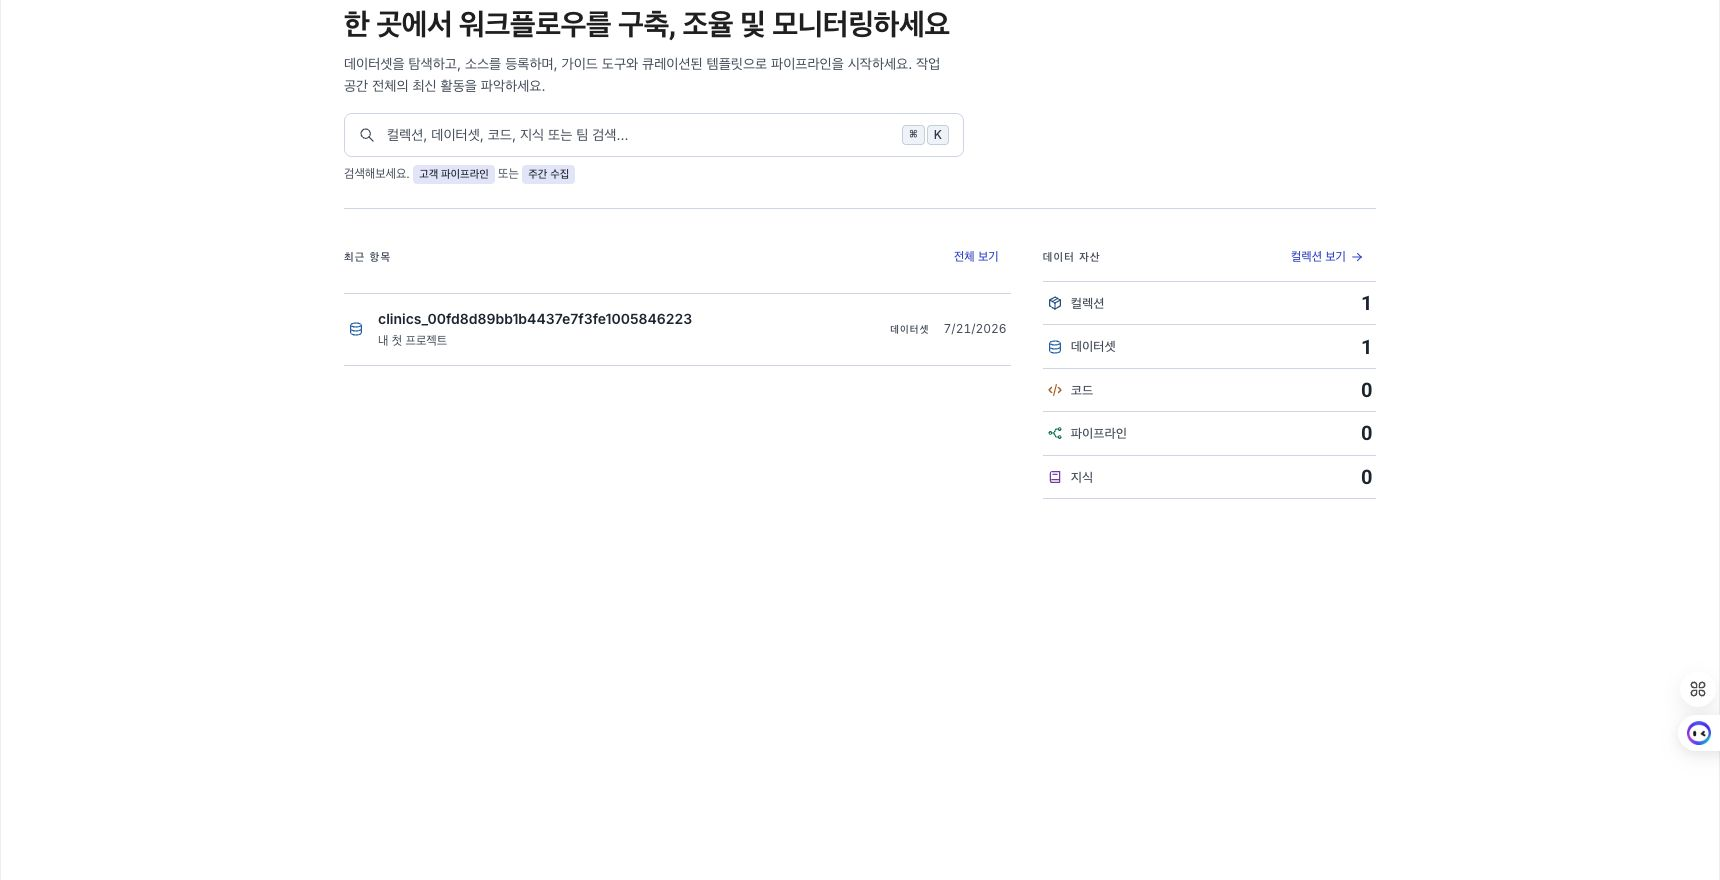
For detailed configuration of the home screen, refer to Home Page. To summarize:
- Top Area: Global search is immediately available with a welcome text.
- Recent Items: Shows 8 recently viewed and worked assets in chronological order.
- Data Asset Summary: Provides asset statistics and shortcuts.
Next steps
Now that you have figured out the basic screen configuration, it's time to actually manage the data.