Running Workflows
Learn how to save and run designed pipelines, along with monitoring capabilities.
Save
You must save changes before running.
Click the Save button on the top toolbar or use the shortcut Ctrl+S.
When saving, basic checks are performed for connection status and missing required settings. If there are errors, the save is blocked and problematic nodes are highlighted.
Manual Run
Batch Pipeline
- Click the Run button (play icon) on the top toolbar.
- When execution starts, the button changes to Stop, and the connection lines on the canvas display flow animations.
- To stop the execution, click the Stop button.
Event Pipeline
- Click the Register button on the top toolbar to register the event listener.
- The pipeline transitions to a Listening state and will automatically execute when events are received.
- To stop receiving events, click the Unregister button.
Scheduling
To run a pipeline periodically:
- Click Settings (gear icon) on the top toolbar.
- Set the frequency in the Schedule tab.
- Once the settings are saved, a Schedule badge is displayed in the pipeline list.
For detailed scheduling configuration, refer to the Scheduling documentation.
Monitoring
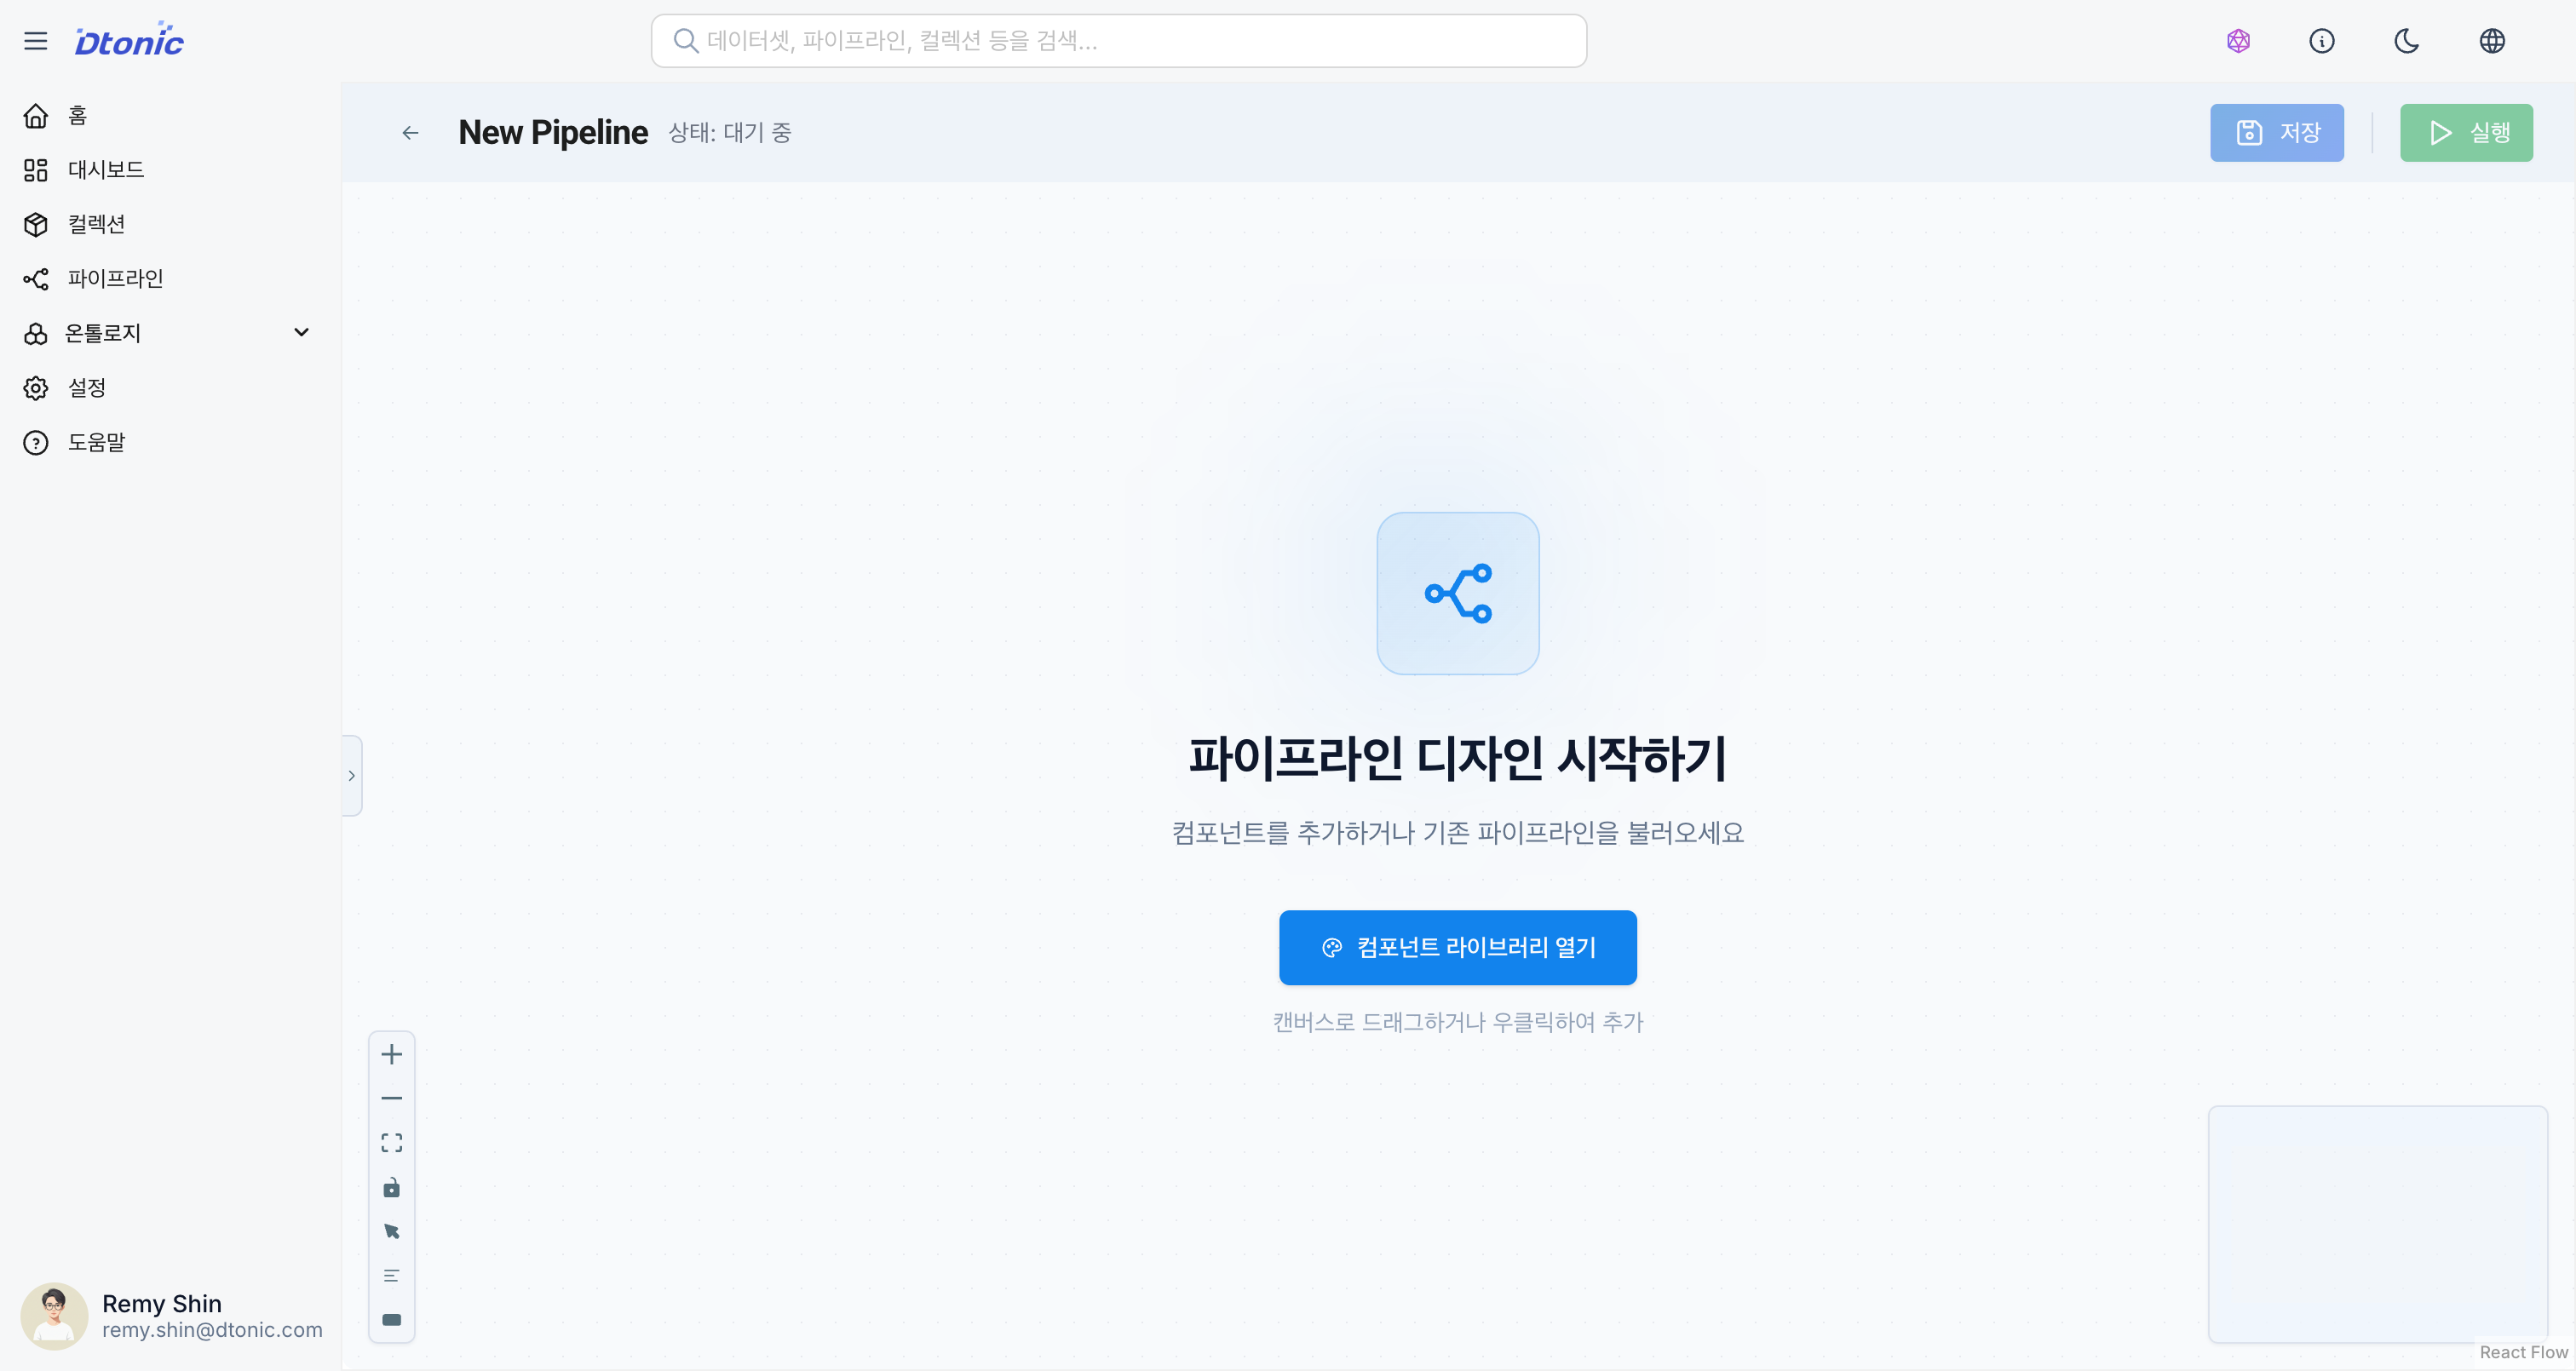
[Screenshot] Workflow execution monitoring
Real-time Status
During execution, each node's status is indicated by a colored border.
| Status | Color | Description |
|---|---|---|
| Running | Blue (animated) | Currently in execution |
| Success (ok/ready) | Green | Completed successfully |
| Failed (error) | Red | Execution failed |
| Pending | Yellow | Waiting (awaiting completion of dependency nodes) |
Run History
The Run History Bar on the top toolbar provides an at-a-glance view of recent execution results. (Batch pipelines only)
- Each bar represents an individual execution run.
- Colors distinguish between success (green) and failure (red).
- Click a bar to view detailed information for that execution.
Batch Details
Clicking an execution run reveals the following information:
- Start/End Time: Execution duration
- Per-node Status: Execution result for each node
- Records Processed: Input/output data statistics
- Logs: Detailed execution logs
Error Handling
What to Check When Execution Fails
- Click the red node: Select the failed node.
- Inspector Panel: Review the error message and stack trace.
- History Tab: Check the execution history and logs in the Code node's History tab.
Common Error Types
| Error Type | Cause | Resolution |
|---|---|---|
| Connection Error | Failed to connect to data source | Check network, credentials |
| Schema Mismatch | Schema incompatibility | Verify input/output schema mapping |
| Code Error | Python/SQL code error | Fix code syntax and logic |
| Resource Limit | Insufficient resources | Reduce data size, adjust partitions |
| Timeout | Execution time exceeded | Optimize queries, adjust timeout settings |