Home Dashboard Overview
The home dashboard serves as D.Hub's control tower. It's the first screen you see after logging in, where you can monitor the status of your data assets and quickly navigate to key tasks.
Key Sections
[Screenshot] Home dashboard
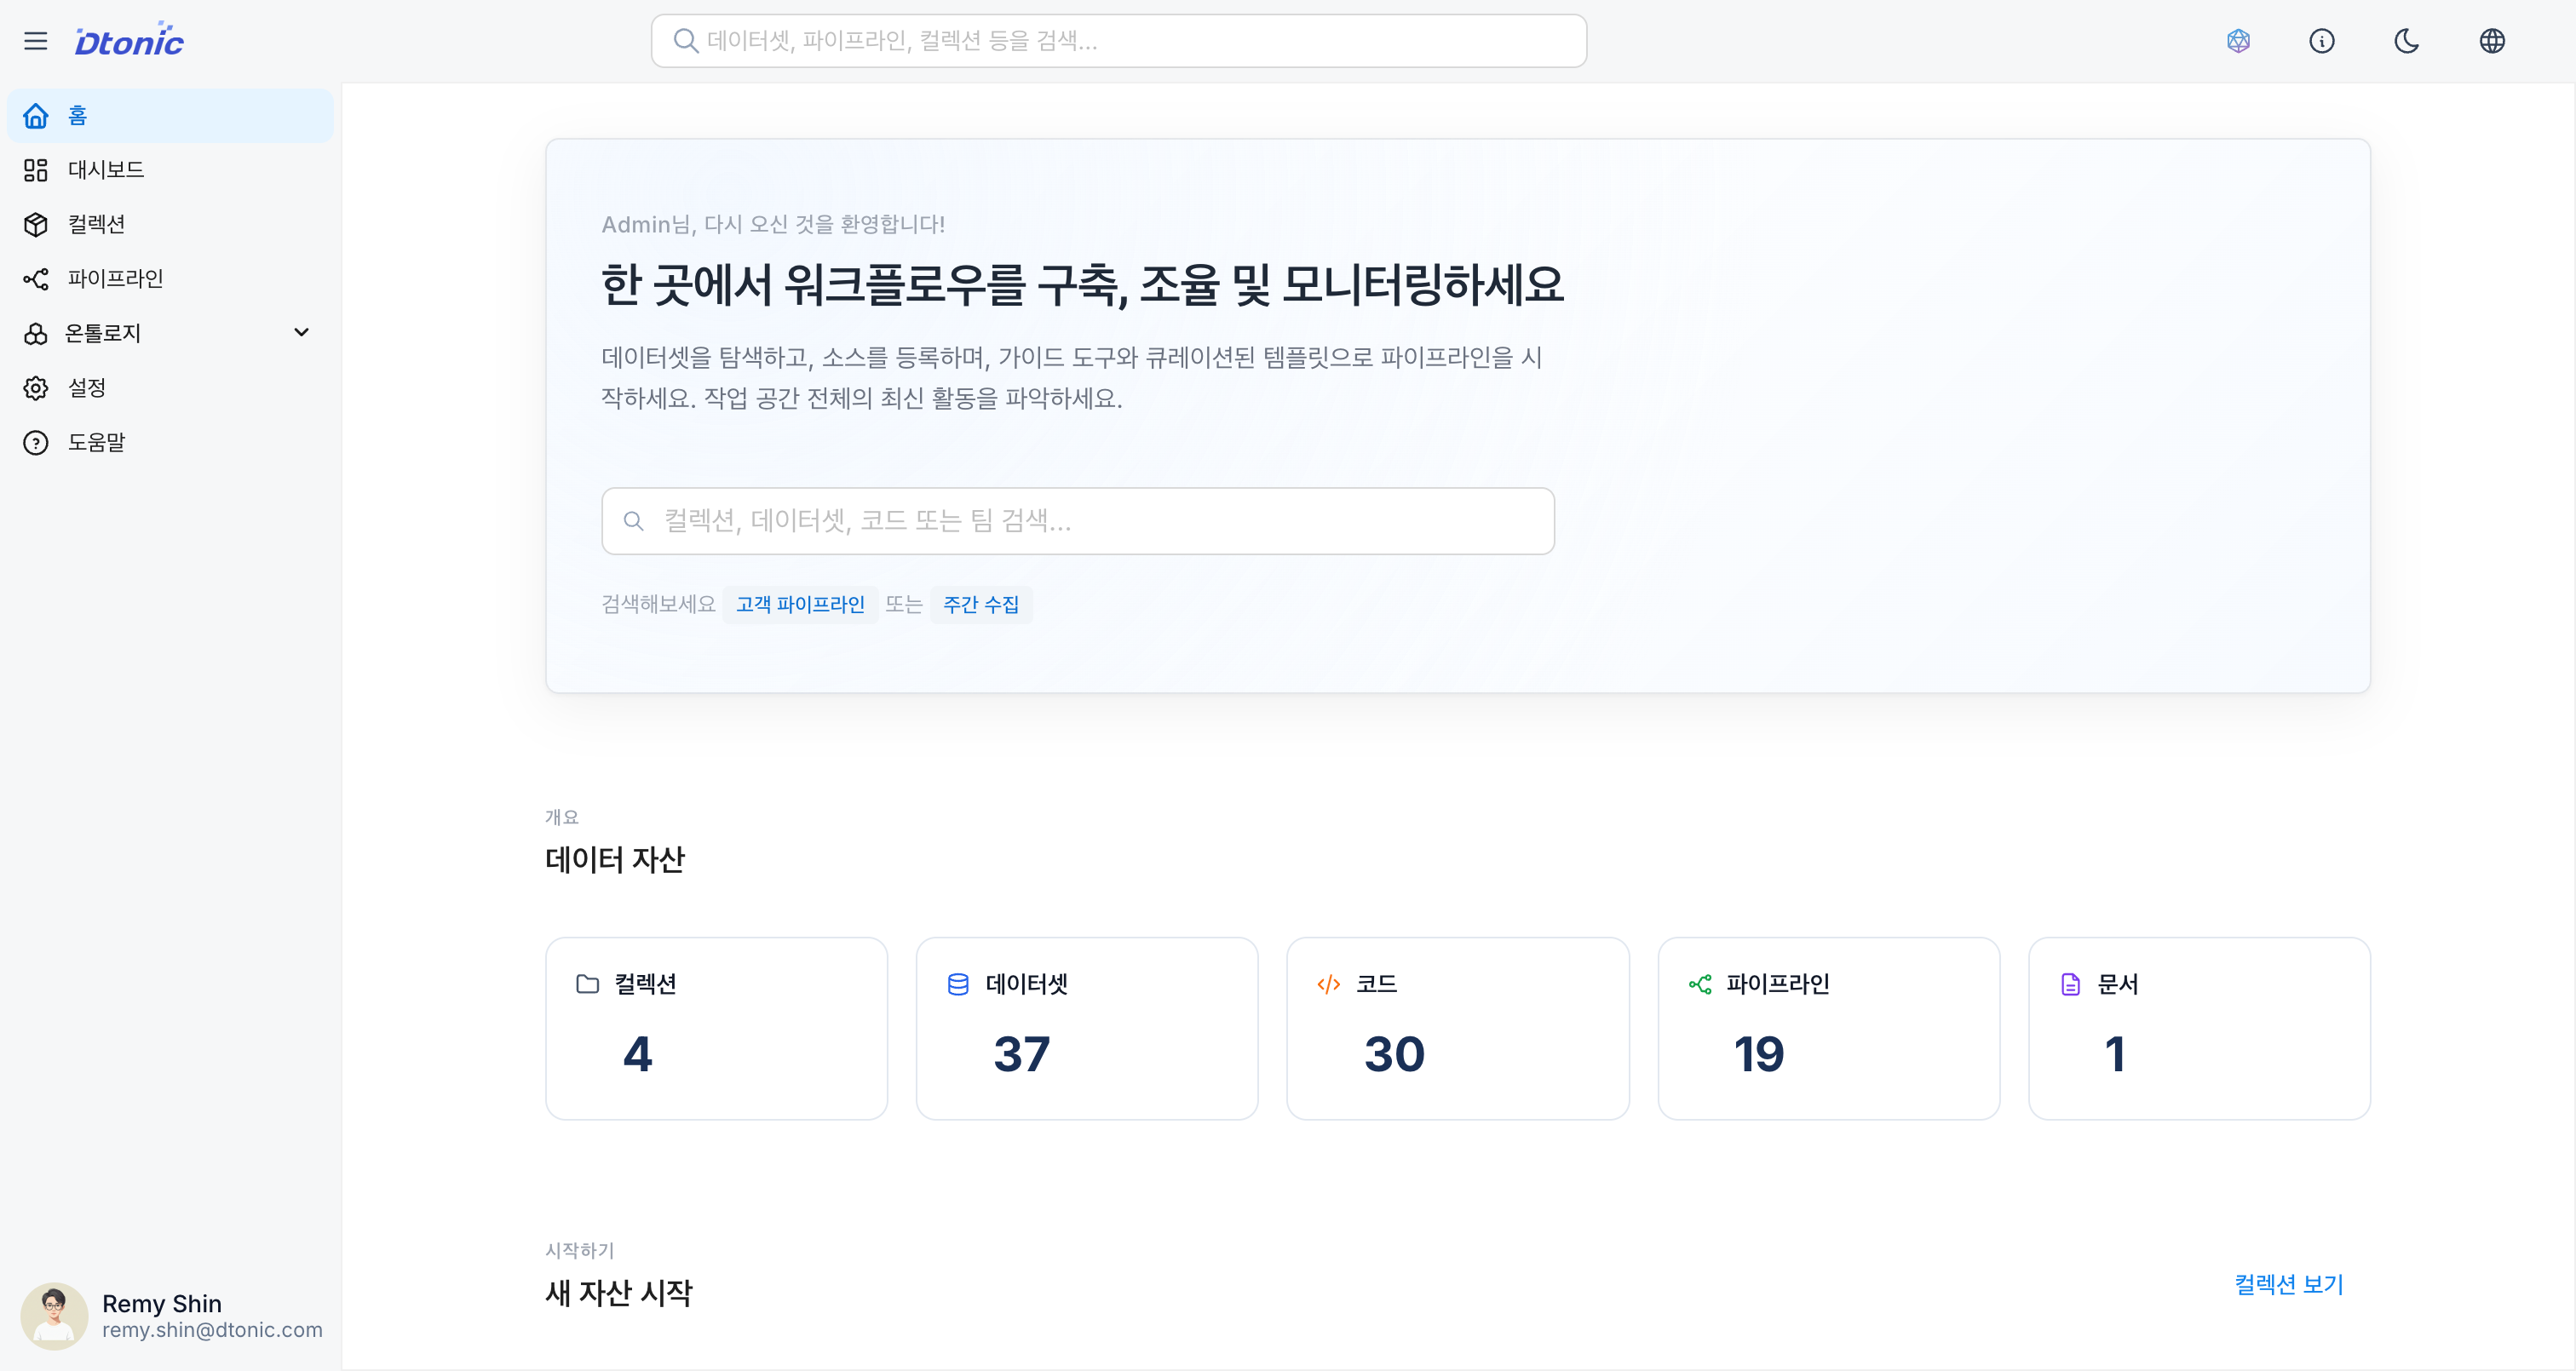
1. Search and Welcome (Hero Section)
At the very top of the screen, there is a welcome message along with a powerful Global Search feature.
- Search: Search for collections, datasets, codes, pipelines, and Knowledge by keyword.
- Shortcut: Open the search bar from any page using
⌘K(macOS) /Ctrl+K(Windows). - Tip: Search with specific keywords like "customer pipeline" or "weekly ingestion" to quickly find what you're looking for.
2. Overview Stats
Statistics cards that give you an at-a-glance view of the scale of data assets in your workspace.
- Collections: Total number of created collections
- Datasets: Number of registered datasets (including those within collections)
- Codes: Number of written SQL and Python codes (excluding internal pipeline codes)
- Pipelines: Number of created workflow pipelines
- Knowledges: Number of created Knowledge items
Click each card to navigate immediately to the corresponding resource management page.
3. Get Started
Quickly start the 4 most frequently performed core tasks.
| Task | Description | Navigation |
|---|---|---|
| Create Collection | Create a new collection to hold datasets, codes, and pipelines. | Collections page |
| Register Dataset | Define data for analysis or connect a streaming source. | Collections page |
| Add Code | Write reusable SQL/Python code for data transformation. | Collections page |
| Create Pipeline | Design a workflow to automate complex data processing. | Pipelines page |
| Create Knowledge | Create a Knowledge for collecting unstructured documents and querying with AI. | Knowledge page |
4. Recent Items
Shows recently updated or created items in chronological order. Helps you resume work without losing context.
- Each item displays its icon, name, type (Collection, Dataset, Code, Pipeline, Knowledge), and associated collection.
- Relative timestamps (e.g., "3h ago", "2d ago") let you see at a glance when items were updated.
- Click to navigate directly to the item's detail page.
- If there are no items, a button prompting you to create your first collection is displayed.
Interface Features
- Responsive Design: The grid layout optimizes based on screen size.
- Skeleton Loading: Skeleton UI is shown during data loading to reduce visual fatigue.